Desarrollo y validación de una escala para evaluar la frecuencia de uso de herramientas y métodos de evaluación en el aula para profesores de matemáticas
Development and validation of a scale to assess the frequency of using classroom assessment tools and methods for mathematics teachers
Osman Birgin
Usak University, Faculty of Education, Türkiye
Murat Yılmaz
100.Yıl Mehmetcik Middle School, Denizli, Türkiye
RESUMEN
Este estudio tiene como objetivo el desarrollo de una escala para evaluar la frecuencia de uso de herramientas y métodos de evaluación en el aula por parte del profesorado de matemáticas. En el estudio participaron 320 profesores de matemáticas turcos. Los datos fueron analizados utilizando los paquetes de software estadístico SPSS 17.0 y LISREL 8.8. Para evaluar la validez del constructo se usó el AFE y el AFC, las correlaciones ítem-total y las validaciones convergente y discriminante. El AFE y el análisis de ítems se realizaron con 170 profesores de matemáticas. Tras el AFE, se identificó una escala de cuatro factores con 25 ítems, que explicaban el 52,38 % de la varianza. El AFC fue llevado a cabo con 150 profesores de matemáticas. Los resultados del AFC de primer y segundo orden indicaron que el modelo de la escala presentaba adecuados índices de ajuste, y se confirmó la validez convergente y discriminante de la escala. Los coeficientes alfa de Cronbach y de fiabilidad compuesta (RC) fueron satisfactorios. Los resultados de este estudio mostraron que la escala es un instrumento fiable y válido para evaluar la frecuencia con que el profesorado de matemáticas utiliza los instrumentos y métodos de evaluación en el aula.
PALABRAS CLAVE
Profesorado de matemáticas; Evaluación en el aula; Herramientas y métodos de evaluación; Elaboración de escalas.
ABSTRACT
The purpose of this study was to develop a scale to assess the frequency of using classroom assessment tools and methods for mathematics teachers. This study was conducted on 320 Turkish mathematics teachers. The data were analysed using the SPSS 17.0 and LISREL 8.8 statistical software packages. EFA and CFA, item-total correlations, and convergent and discriminant validities were used to assess the construct validity. EFA and item analysis were performed with 170 mathematics teachers. After EFA, a four-factor scale with 25 items was identified, explaining 52.38 % of the variance. The CFA was carried out with 150 mathematics teachers. The first and second-order CFA results indicated that the scale model had good fit indices, and the convergent and discriminant validity of the scale was confirmed. The Cronbach’s alpha and composite reliability (CR) coefficients were satisfactory. The results of this study showed that the scale is a reliable and valid instrument for assessing the frequency of mathematics teachers’ use of classroom assessment tools and methods.
KEYWORDS
Mathematics teacher; Classroom assessment; Assessment tools and methods; Scale development.
1. Introduction
In recent years, curriculum development studies have shifted from teacher-centred teaching approaches to student-centred teaching approaches such as collaborative learning, project-based learning, and social constructivist learning (National Council of Teachers of Mathematics [NCTM], 2020; Ministry of National Education [MoNE], 2018). In addition to procedural and conceptual learning, higher-order thinking abilities such as problem-solving, reasoning, critiquing, analysing, synthesizing, and creating are highlighted (Krathwohl, 2002; Mullis et al., 2016). In the student-centred approach to education, the connection of concepts to everyday life, active participation in the teaching process, and the construction of students’ knowledge are crucial (Fosnot, 1996). Furthermore, assessment is an integral part of the teaching process, focusing on both the products and the process of learning (Shepherd, 2000). As a result, classroom assessment requires the use of alternative assessment tools and methods that enable students to determine their performance in the learning process, identify their strengths and areas for development, and measure high-level knowledge and skills (Birgin, 2010).
The Turkish mathematics curriculum (MoNE, 2018), which has been updated in parallel with contemporary education approaches, emphasises the use of various alternative assessment methods rather than a single assessment method to determine student achievement. As a result, in addition to traditional and objective assessment tools (e.g., written examinations, multiple-choice tests), teachers are expected to use alternative assessment tools in the learning process, such as performance tasks, portfolios, demonstrations, interviews, observations, self-and peer- assessment, rubrics, and concept maps. Implementation of the curriculum is largely possible with teachers who have pedagogical knowledge and experience of the curriculum’s teaching and assessment approaches. Research findings that reveal teachers’ inadequacies and lack of knowledge about alternative assessment tools in Türkiye (e.g., Aras, 2020; Birgin & Baki, 2009; Gelbal & Kelecioğlu, 2007; Gök & Şahin, 2009; Özenç & Çakır, 2015) raise concerns about the quality of classroom assessment practices.
In the literature, the frequency of use of teachers’ assessment techniques has been investigated using instruments such as questionnaires, scales, observation, and interviews. It was found that scale development studies to assess the frequency of use of teachers’ assessment tools and methods, on the other hand, were limited (e.g., Adams & Hsu, 1998; Bol et al., 1998; Cizek et al., 1995; McMillan et al., 2002; Nazlıçicek & Akarsu, 2008; Yıldırım Ekinci & Köksal, 2011). While exploratory or confirmatory factor analysis was conducted in some studies to assess the use of teachers’ assessment techniques (e.g., Bol et al., 1998; McMillan et al., 2002; Yıldırım et al., 2011), some instruments were developed based on expert opinion in other studies. Moreover, the scale items and the sub-factors, which were previously developed for determining teachers’ assessment tools and methods, differed according to curricula, grades, and course types. In addition, some studies showed that the preferred assessment techniques of mathematics teachers differed from those of teachers in other disciplines (e.g., Bol et al., 1998; Nazlıçiçek & Akarsu, 2008; McMillan et al., 2002). As a result, there is a need for an instrument to assess the use of classroom assessment tools and methods that are compatible with the mathematics curriculum in Türkiye. This study aims to develop a scale to assess the frequency of use of classroom assessment tools and methods for mathematics teachers. This study contributes to filling the gap in the literature.
1.1. Importance of Classroom Assessment
Assessment serves several purposes, including determining student achievement, placement in the curriculum, determining the effectiveness of the curriculum, teaching methods and strategies, identifying students’ learning strengths and weaknesses, and monitoring their development (MoNE, 2018). However, the classroom assessment to support teaching and learning is fundamentally different from large-scale testing designed to monitor trends, hold schools to account, evaluate teachers and programmes, or inform the selection and placement decisions (Shepard, 2020). As a result, classroom assessment is typically used for diagnostic, formative, and summative assessment in the teaching process (Black & William, 1998; Stiggins, 1997). Diagnostic assessment is used at the beginning of the teaching process to gather detailed information about students’ prior knowledge, misconceptions, interests, abilities, and other characteristics. It is a specific form of formative assessment. This assessment allows for the selection, organisation and planning of content, teaching methods and strategies based on the needs of the students. Formative assessment is used to monitor students’ learning processes throughout the instruction and design the learning environments to optimise learning (Wiliam, 2011). Formative assessment aims to identify and compensate for errors and deficiencies in learning, rather than grading. This assessment is seen as a way of determining student progress, providing feedback, and determining future instructional activities (McMillan, 2013). As a result, the formative assessment focuses on the students’ learning and development and helps to eliminate deficiencies and structure knowledge (Birgin & Baki, 2012). Another type of assessment is a summative assessment, which is usually conducted at the end of the teaching period to assess learning, certification, and accountability. This assessment is used to determine whether students have achieved the objectives and for grading. It is usually carried out with examinations at the end of the unit or term (Shepard, 2000).
In recent years, classroom assessment has been described using the concepts of assessment of learning (AoL), assessment for learning (AfL), and assessment as learning (AaF) (Assessment Reform Group [ARG], 1999; Black & Wiliam, 2018; Earl, 2012; McMillan, 2013; Sadeghi & Rahmati, 2017). The concepts of AaL, AfL and AoL reflect different approaches to assessment. In general, AaL describes the active participation of students in assessment and learning, AfL describes the identification of learning throughout the assessment, and AoL describes the measurement of learning through assessment (Schellekens et al., 2021). AoL is a formal assessment of what a learner has learned at the end of a chapter, module, or course. The purpose of the AoL is to identify and label students’ successes or failures as a result of the teaching process (Schellekens et al., 2021). It is generally used to assess performance and measure outcomes following a formal learning activity. It often takes the form of a test or examination. It also functions as a summative assessment (Earl, 2012). AfL is an approach to teaching and learning that generates feedback that is used to improve the performance of students (ARG, 1999). AfL requires students to become more engaged in their learning. The purpose of the AfL approach is to motivate students, provide feedback, and identify areas for further learning. AfL has been linked to formative assessment because it helps to structure student learning through practices such as questioning and providing feedback (McMillan, 2013; Schellekens et al., 2021). AaL, like the AfL, has a strong focus on the metacognitive learning processes and describes the role of students in monitoring and directing their learning (Black & Wiliam, 2018). AaL involves active student participation in self-assessment and self-directed learning as a distinct function to enhance the learning process (Earl, 2012). AaL promotes student independence and flexibility to improve learning. According to this approach, the student is seen as an active evaluator to support the development of metacognitive and self-regulated learning skills (Lam, 2016).
In the AoL approach, traditional and objective assessment methods such as multiple-choice, fill-in-the-blank, short-answer items, and written tests are generally used for a period of time. However, these assessment tools are not sufficient to ensure student development and address learning deficits (Birgin, 2010; Stiggins, 1997). AfL and AaL approaches, on the other hand, impose new roles on teachers and students (ARG, 1999; Lam, 2016). In these approaches, the teachers are expected not only to assess the learning product but also to organise the learning environment and guide students to facilitate learning, while students are expected to actively participate in the learning process and assess themselves and their peers.
According to Klenowski (2009), AfL is conceived as being at the centre of classroom practice, thus representing the close relationship between the teacher and the student in the assessment process. Similarly, AaL is a formative assessment strategy that is part of ongoing classroom practice and aims to improve the quality of students’ learning processes (Clark, 2012). Numerous studies have provided evidence to support formative assessment (AfL and AaL implementation), which has been shown to increase achievement and conceptual learning (e.g., Andersson & Palm, 2017; Black & Wiliam, 1998; Heritage & Wylie, 2018; Kingston & Nash, 2011; Kyaruzi et al., 2019), allow students to take more responsibility for their learning, and motivate students to learn (e.g., Arnold, 2022; BBlack & Wiliam, 2018; DeLuca et al., 2018; Wiliam, 2011). In addition, shared student success criteria, peer support, and teacher feedback through AfL and AaL practices helped students participate in their learning and were given opportunities to improve their work (e.g., Baas et al., 2020; Deluca et al., 2018; McDowell et al., 2011; Schellekens et al., 2021). Furthermore, Lam (2016) found that AfL, when advocated in classroom-based portfolios, can promote students’ motivation for learning and facilitate the development of students’ language awareness, self-assessment skills, and self-reflection. Therefore, AaL, AfL, and AoL should be balanced in the design and implementation of the lesson plans, courses, and curricula to gain the benefits of each assessment and to promote student learning (Schellekens et al., 2021). In this context, in addition to traditional and objective assessment tools, a variety of alternative assessment methods (e.g., performance task, project, portfolio, self- and peer- assessment, interview, demonstration, student journal, concept map) should be used to focus on the learning process, to monitor students’ development and to provide more feedback.
1.2. The Classroom Assessment Approach in the Turkish Mathematics Curriculum
After 2005, the primary and secondary education curricula in Türkiye were updated based on contemporary pedagogical approaches. The revised mathematics curriculum (MoNE, 2013; 2018) emphasised conceptual learning and high-level knowledge and skills. The objectives of the mathematics curriculum include applying learned knowledge and skills to everyday problems, developing mathematical reasoning and problem-solving skills, making connections between mathematical concepts and other disciplines, having positive attitudes and confidence in mathematics, acquiring self-regulation skills, using mathematics as a communication tool, and developing both aesthetic and mathematical skills (MoNE, 2018). The approach of the revised curriculum has also fundamentally changed assessment practices. According to the updated mathematics curriculum (MoNE, 2018), assessment should be used to measure students’ performance in the learning process, detect shortcomings, understand the effectiveness of teaching techniques, and show the weak and strong parts of teaching. Assessment should be used to monitor student progress and to support the learning process. The use of performance-based methods and a variety of assessment tools is also recommended to identify students’ learning levels and to support the development of different knowledge and skills.
In order to be aware of learning deficits and develop higher-order thinking skills, the mathematics curriculum (MoNE, 2018) recommends the use of alternative assessment methods such as portfolios, projects, performance tasks, rubrics, class discussions, presentations, exhibitions, observations, interviews, self- and peer-assessment, and concept maps, in addition to limited examinations. This approach implies that assessment is an integral part of the teaching process in the revised curriculum, that both the learning product and the learning process are considered in determining student performance, and that diagnostic and formative assessment are important as well as summative assessment.
According to the Ministry of National Education’s Preschool Education and Primary Education Institutions Regulation (MoNE, 2014), the success of middle school students is determined based on exam results, participation in lesson activities, and, if any, project tasks (p. 7). In the regulation, participation in lesson activities is defined as “the activities that students do in the classroom or school that enable them to use and develop their cognitive, affective, and psychomotor skills, such as critical thinking, problem-solving, reading comprehension, and research” (p. 1). In this regard, it is recommended to use product and process-oriented assessments, to actively engage students in the assessment, to consider individual and group performance, cognitive, affective, and psychomotor development, and participation in classroom activities. This curriculum approach suggests that AoL, AfL, and AaL should be balanced in the teaching process.
1.3. Previous Research on Teachers’ Use of Assessment Tools and Methods
Teachers’ knowledge and experience of classroom assessment are crucial to assessment practices (Zhang & Burry-Stock, 2003). Many studies have been conducted in different countries to determine teachers’ classroom assessment practices and their use of assessment tools (e.g., Adams & Hsu, 1998; Birgin & Baki, 2012; Brookhart, 1993; Cheng & Sun, 2015; Duncan & Nooman, 2007; Gök & Şahin, 2009; McMillan, 2001; McMillan et al., 2002; Randall & Engelhard, 2010; Zhang & Burry-Stock, 2003). For example, in a study conducted with 893 teachers, Bol et al. (1998) found that primary school teachers were significantly more likely to use alternative assessment strategies than high school teachers. Mathematics teachers also preferred traditional assessment methods much less than teachers of other subjects. In their study of 470 middle school teachers, Yazıcı and Sözbilir (2014) investigated teachers’ frequency of use and levels of proficiency in assessment methods. The results showed that teachers preferred traditional assessment methods over alternative approaches. It was found that there was a positive and significant relationship between the frequency of use and adequacy level of assessment methods. It was also found that the frequency of use and the level of adequacy of assessment methods differed significantly according to the year of teaching, gender, and subject. On the other hand, previous studies have revealed that many factors influence teachers’ classroom assessment practices, and these factors vary according to the curriculum applied in the county and grade (e.g., Cizek et al., 1995; Duncan & Noonan, 2007), teacher’s level of knowledge and proficiency in assessment (e.g., Birgin, 2010; Zhang & Burry-Stock, 2003), and their beliefs about assessment tools (e.g., Sun & Cheng, 2014).
The results of the previous studies showed that most of the teachers in Türkiye considered themselves more competent in using traditional and objective assessment tools, but they lacked sufficient knowledge and experience in using alternative assessment tools and methods and had difficulties (e.g., Duran et al., 2013; Gelbal & Kelecioğlu, 2007; Nazlıçiçek & Akarsu, 2008). Teachers used more summative assessment practices, adapted traditional classroom assessment practices to the updated curriculum (Birgin & Baki, 2012), and preferred alternative assessment tools less (e.g., Aras, 2019; Gök & Şahin, 2009; Peker & Gülle, 2011; Yıldızlı, 2020). Teachers mostly used mixed question types (e.g., written answer required, multiple choice, and short answer) in examinations, and they preferred less alternative assessment methods other than the compulsory project and performance task (Acar-Erdol & Yıldızlı, 2018; Birgin, 2010).
Some studies have investigated the frequency of teachers’ use of assessment techniques using an instrument such as a questionnaire, scale, observation, and interview. However, there are few scale development studies to determine the assessment tools and methods used by teachers (e.g., Adams & Hsu, 1998; Bol et al., 1998; Cizek et al., 1995; McMillan et al., 2002; Nazlıçicek & Akarsu, 2008; Peker & Gülle, 2011). In this context, Bol et al. (1998) developed a 5-point scale with two sub-factors related to the use of teachers’ assessment techniques as alternative assessment methods (portfolios, observations, performance assessment, self-assessment) and traditional assessment methods (closed-ended items, open-ended items, written assignments). Nazlıçiçek and Akarsu (2008) used a 5-point Likert-type scale consisting of 23 items and three sub-dimensions on the frequency of use of assessment tools by physics, chemistry, and mathematics teachers. These sub-factors are traditional assessment (e.g., written exam, test, quiz, homework, open-ended question), alternative assessment (e.g., portfolio, project, observation, concept map, experiment report, self-assessment), and other assessment tools (e.g., class participation, effort, and development, attitude, learning style). Peker and Gülle (2011) investigated the frequency of use of assessment tools by secondary school mathematics teachers using a 12-item scale with three sub-factors (homework-type assessment tools, classical assessment tools, and alternative assessment tools). In their study with science teachers, Büyüktokatlı and Bayraktar (2014) used a 4-point scale with 17 alternative assessment techniques (e.g., project, performance, drama, puzzle, worksheet, poster, structured grid, meaning analysis table) on the frequency of use of alternative assessment techniques. In the study with social studies teachers, Çalışkan and Kaşıkçı (2010) used an instrument that included six traditional assessment tools (e.g., open-ended test, short answer, matching item, oral exam) and twelve alternative assessment tools (e.g., project, performance task, portfolio, observation form, interview, concept map, word association, self-and peer- assessment). Duran et al. (2013) used a 5-point Likert-type scale with nine alternative assessment tools for primary school teachers.
Previous research has shown that the scales and sub-factors constructed to determine the frequency of teachers’ use of assessment tools and methods varied by the curriculum, grade level, and course. Furthermore, only a few scales had construct validity confirmed by EFA or CFA. As a result, there is a need for a valid and reliable scale to assess the frequency of teachers’ use of classroom assessment tools and methods consistent with the updated Turkish mathematics curriculum. This study is expected to fill this gap.
2. Methods
2.1. Participants
The participants in the study were selected through voluntary and purposive sampling. The location of the school, the type of school (secondary school, high school), and the seniority of the teachers were used as criteria in the selection of purposive sampling. The study group consists of a total of 320 mathematics teachers in a province in the south-western region of Türkiye. This study was carried out with two sample groups selected through a convenience sampling method. Item analysis and exploratory factor analysis (EFA) of the scale were carried out with the first study group consisting of 170 mathematics teachers. Confirmatory factor analysis (CFA) of the scale was conducted with the second study group consisting of 150 mathematics teachers.
As can be seen in Table 1, 180 of the participants worked in middle schools (grades 5–8) and 140 of them were in high schools (grades 9–12). 49.7 % (n=159) of the participants were female and 50.3 % (n=161) were male mathematics teachers. Regarding the location of the school, 50 % (n = 160) of the participants were located in the city centre, 31.6 % (n = 101) of them were located in the provincial centre, and 18.4 % (n = 59) of them were located in the countryside. In terms of professional seniority, 15.3 % of participants had 1–5 years of seniority; 20.6 % of them had 6–10 years of seniority; 15.6 % of them had 11–15 years of seniority; 16.6 % of them had 16–20 years of seniority; and 31.9 % of them had more than 20 years of seniority.
|
Variable |
Study Group I (n = 170) |
Study Group II (n = 150) |
Total (n = 320) |
||
|
n |
% |
||||
|
Gender |
Female |
88 |
71 |
159 |
49.7 |
|
Male |
82 |
79 |
161 |
50.3 |
|
|
Grade Level |
Middle School |
93 |
87 |
180 |
56.3 |
|
High School |
69 |
71 |
140 |
43.8 |
|
|
Seniority |
1–5 years |
26 |
23 |
49 |
15.3 |
|
6–10 years |
37 |
29 |
66 |
20.6 |
|
|
11–15 years |
30 |
20 |
50 |
15.6 |
|
|
16–20 years |
32 |
21 |
53 |
16.6 |
|
|
+ 20 years |
55 |
47 |
102 |
31.9 |
|
|
Location of School |
City Centre |
85 |
75 |
160 |
50.0 |
|
District Centre |
53 |
48 |
101 |
31.6 |
|
|
Countryside |
32 |
17 |
59 |
18.4 |
|
2.2. Scale Development Process and Data Analysis
The first step was to develop scale items for the classroom assessment tools and methods used by mathematics teachers. For this purpose, previous studies were reviewed (e.g., Adams & Hsu, 1998; Aras, 2019; Bol et al., 1998; Cheng & Sun, 2015; Cizek et al., 1995; Duncan & Noonan, 2007; Gelbal & Kelecioğlu, 2007; McMillan, 2001; McMillan et al., 2002; Peker & Gülle, 2011; Yıldırım Ekinci & Köksal, 2011). In addition, the Turkish mathematics curriculum for middle and high school, which was updated in 2018, was reviewed. Following the literature review, 33 draft items were created by considering the types of questions (open-ended, multiple-choice, short-answer, fill-in-the-blank, matching, true-false, and mixed), traditional and alternative assessment tools and methods that can be used in mathematics (unit follow-up test, in-class observation, homework, performance task, project, self-assessment, peer-assessment, group assessment, demonstration, oral presentation, rubric, portfolio, class discussion, student journal, interview, concept map, diagnostic branching tree, structured grid, mathematics attitude scale, worksheet, poster, crossword puzzle, drama, word association test, semantic feature analysis, knowledge competition).
The draft scale was reviewed for content, face, and language validity by two experts in mathematics education, one expert in measurement and assessment education, two experts in educational science, and eight experienced mathematics teachers. Following the opinions and suggestions of the experts and mathematics teachers, it was decided to remove four items (poster, drama, semantic feature analysis, and knowledge competition) because they were less used in mathematics lessons. The items were scored on a 5-point Likert scale (1 = not at all, 5 = always) for the frequency of using classroom assessment tools.
In this study, ethical approval and institutional approval were obtained before the instrument application. Informed consent was obtained from the participants and the research was conducted on a voluntary participation basis. The validity and reliability procedures of the scale were carried out in two stages. In the first stage, the scale was administered to 170 mathematics teachers to determine the factor structure of the scale. Each item was scored from 1 (not at all) to 5 (always). The statistical software package SPSS 17.0 was used for data analysis. Before the data analysis, missing data, normality test, linearity, and extreme value analysis (except for the values of -3 and +3) were performed to check the appropriateness of the analyses and the assumptions. Items that were left blank (missing data) were not included in the calculation of the scale scores. Data with extreme values were excluded from the analysis. It was found that the kurtosis (-.110) and skewness (-.305) values of the data for the first study group ranged from -1 to +1 and had a normal distribution. To examine the factor structure of the scale, exploratory factor analysis (EFA) was performed using the principal component analysis and the Promax rotation method to allow for correlations between the factors. The item-total correlation and the item discrimination index were used to analyse the items.
In the second stage, confirmatory factor analysis (CFA), convergent and discriminant validity were carried out with 150 mathematics teachers to confirm the factor structure of the scale. Cronbach’s alpha and composite reliability (CR) coefficients were calculated to measure the internal consistency of the scale and its sub-factors. The kurtosis and skewness values of the data for CFA were found to be -.335 and -.230, respectively, and the data had a normal distribution. The CFA was carried out using the LISRELL 8.8 statistical software.
3. Findings
3.1. Results of the Exploratory Factor Analysis (EFA)
To determine the factor structure of the scale, EFA was performed. Kaiser-Meyer-Olkin (KMO) proficiency test and Bartlett’s sphericity test were used to determine the suitability of the data for factor analysis. The result of the KMO test was found to be.767, which indicated good sampling adequacy. In addition, Bartlett’s sphericity test was significant (= 1753.17, df = 325, p <.001), which showed that the items were correlated and a factor analysis could be applied (Tabachnick & Fidel, 2007). Latent factors were extracted using Principal Component Analysis (PCA) and the Promax rotation method. The Promax rotation method is an oblique rotation that allows for correlations between the factors (Tabachnick & Fidell 2007). It was recommended that each factor contain at least three items with loadings greater than.40 and no cross-loadings (Kline, 2016). The Initial factor analysis extracted seven factors with eigenvalues greater than 1.00, explaining 64.07 % of the variance (Figure 1). As three factors had three or fewer items, factor analysis was restricted to four factors.
Figure 1. Scree plot graph of the scale
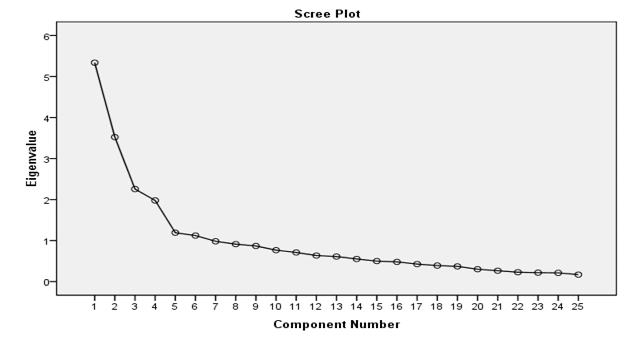
It was found that one item loading (C14. Oral presentation) was below.30, and three items (C27. Worksheet, C28. Crossword puzzle, C29. Word association test) cross-loaded on more than one factor. Therefore, four items were removed and factor analysis was repeated on the remaining 25 items. Repeated factor analysis revealed a four-factor scale with eigenvalues greater than 1.5, explaining 52.38 % of the variance, and factor loadings ranging from.513 to.848 (Table 2). Item common factor variances ranged from.40 to.67.
Table 2. Pattern matrix of scale and factor loadings.
|
Item |
Factor Common Variance |
Factor 1 |
Factor 2 |
Factor 3 |
Factor 4 |
|
C22. Student journal |
.628 |
.797 |
|||
|
C25. Diagnostic branching tree |
.658 |
.769 |
|||
|
C26. Structure grid |
.531 |
.726 |
|||
|
C23. Concept map |
.538 |
.714 |
|||
|
C12. Peer-assessment |
.532 |
.699 |
|||
|
C11. Self-assessment |
.626 |
.658 |
|||
|
C10. Math attitude scale |
.567 |
.656 |
|||
|
C24. Interview |
.384 |
.509 |
|||
|
C5. Matching item |
.669 |
.848 |
|||
|
C6. True-False item |
.675 |
.835 |
|||
|
C4. Fill-in-the blank item |
.676 |
.825 |
|||
|
C3. Short answer item |
.429 |
.693 |
|||
|
C7. Mixed items |
.497 |
.653 |
|||
|
C2. Multiple-choice item |
.432 |
.607 |
|||
|
C16. Project assessment |
.579 |
.734 |
|||
|
C21. Portfolio |
.532 |
.735 |
|||
|
C19. Class discussion |
.558 |
.699 |
|||
|
C18. Rubric |
.467 |
.609 |
–.316 |
||
|
C13. Demonstration |
.456 |
.598 |
|||
|
C17. Performance task |
.440 |
.591 |
|||
|
C20. Group assessment |
.406 |
.514 |
|||
|
C8. Unit follow-up test |
.563 |
.767 |
|||
|
C9. In-class observation |
.444 |
.698 |
|||
|
C1. Open-ended question |
.418 |
.622 |
|||
|
C15. Homework |
.402 |
.513 |
|||
|
Eigenvalue: |
13.07 |
5.33 |
3.52 |
2.25 |
1.97 |
|
Explained variance: |
52.38 % |
21.36 % |
14.09 % |
9.02 % |
7.91 % |
|
Cronbach’s alpha (α): |
.91 |
.95 |
.86 |
.93 |
.84 |
As can be seen in Table 2, the factor loadings of the first sub-factor, consisting of eight items, ranged from.509 to.797 and explained 21.36 % of the variance, the factor loadings of the second sub-factor, consisting of six items, ranged from.607 to.848 and explained 14.09 % of the variance. The factor loadings of the third factor, consisting of seven items, ranged from.514 to.734 and explained 9.02 % of the variance, and the factor loadings of the fourth sub-factor, consisting of four items, ranged from.513 to.767 and explained 7.91 % of the variance. The internal consistency of the sub-factors was assessed using Cronbach’s alpha coefficient, all of which ranged from.84 to.95 and were greater than.70, indicating good consistency (Table 2).
The sub-factors of the scale were named according to the characteristics of the items they contained. The items in the first factor (student diary, diagnostic branching tree, structured grid, peer assessment, self-assessment, interview, concept map, attitude scale) were named “alternative assessment methods” because they were mostly related to alternative assessment tools, the items in the second factor (multiple-choice, short-answer, fill-in-the-blank, true/false, matched, mixed) were named “objective assessment methods” because they were mostly related to objective assessment tools. The items in the third factor (portfolio, project, performance task, rubric, group assessment, demonstration, class discussion) were named “performance assessment methods” because they were performance assessment tools, and the items in the fourth factor (unit follow-up test, class observation, open-ended question, homework) was named as “traditional assessment methods” because they were the assessment tools traditionally used by teachers.
3.2. Results of the Item Analysis
For the item analysis, the item-total correlation was first calculated. It is emphasised that an item-total correlation greater than.30 has good discriminating power, an item-total correlation between.20 and.30 can be included in the scale if it is considered necessary, and an item-total correlation less than.20 should be eliminated from the scale (Field, 2009).
Table 3. Item-total correlations, t-test results for upper and lower groups.
|
Item |
Item-Total Correlation |
t–value for item (upper - lower group) |
Item |
Item-Total Correlation |
t–value for item (upper - lower group) |
|
C22 |
.528** |
10.118** |
C2 |
.326** |
3.148* |
|
C25 |
.571** |
8.006** |
C21 |
.617** |
5.246** |
|
C26 |
.654** |
8.384** |
C16 |
.520** |
4.270** |
|
C12 |
.642** |
7.506** |
C19 |
.611** |
6.916** |
|
C23 |
.489** |
9.294** |
C18 |
.596** |
9.294** |
|
C10 |
.632** |
7.267** |
C13 |
.635** |
4.714** |
|
C11 |
.605** |
8.777** |
C17 |
.560** |
4.662** |
|
C24 |
.635** |
5.782** |
C20 |
.612** |
5.246** |
|
C5 |
.448** |
3.651** |
C8 |
.406** |
3.653** |
|
C6 |
.344** |
3.291** |
C9 |
.365** |
3.185* |
|
C4 |
.308** |
3.253** |
C1 |
.347** |
3.738** |
|
C7 |
.317** |
3.867** |
C15 |
.420** |
3.482** |
|
C3 |
.320** |
3.229** |
Note: *p <.05 **p <.01
Table 3 shows that the item-total correlations ranged from.308 to.654 and were significant (p <.01). Another way to determine the distinctiveness of the scale items was to compare the scores of the 27 % upper and lower group scores using the t-test. As can be seen in Table 3, the results of the t-test for the 27 % upper and lower groups of the scale items ranged from 3.148 to 10.188 and were significant (p <.01). These results showed that all items on the scale were discriminative.
3.3. Results of Confirmatory Factor Analysis (CFA)
Another way to test the construct validity of the scale is to use CFA (Tabachnick & Fidell 2007). Many fit indices are used in the CFA. Among the fit indices used in this study are the ratio of chi-square/degrees of freedom ( RMSEA (Root Mean Square Error of Approximation), IFI (Incremental Fit Index), GFI (Goodness of Fit Index), AGFI (Adjusted Goodness of Fit Index), CFI (Comparative Fit Index) and NFI (Normed Fit Index), S-RMR (Standardised Root Mean Square Residual). For model fit, the ratio of should be less than 3, but less than 5 is also acceptable (Çokluk et al., 2012; Kline, 20011). It is suggested that SRMR and RMSEA should be ≤.05 to obtain the best fit and ≤.08 to represent a good fit; IFI, CFI, and NNFI should be ≥.90 for a good fit (Çokluk et al., 2012; Kline, 2011), GFI and AGFI should be ≥.80 to obtain an acceptable fit (Schermelleh-Engel et al., 2003; Tabachnick & Fidell 2007).
In order to confirm the four factors of the scale on 150 mathematics teachers who were not part of the first sample group, a first-order CFA was conducted using LISREL 8.8. As a result of this analysis, the chi-square test ( for goodness of fit was calculated as 567.71 (df = 269, p <.001), and the ratio of was found to be 2.11, which was less than 3. This result showed that the model had a good model fit. In addition, modifications were suggested for four items (C3 and C2, C17 and C16). Following the necessary modifications based on the results of the analysis, a path diagram with 25 items consisting of this four-factor structure was constructed (Figure 2). The standardised factor loadings of the items ranged from.57 to.94, and the t-test results for the items varied from 7.24 to 15.39, which were significant (p <.01).
As can be seen in Table 4, the first-order CFA fit index after structural modifications was found to be = 1.35 (= 359.55, df = 267, p <.001), which was less than 3. This result indicated that the model had a good fit (Kline, 2016). Other fit indices for the final model were found to be RMSEA =.048, NNFI =.98, IFI =.98, GFI =.84, CFI =.98, AGFI =.80, and SRMR =.060, respectively. Some fit indices (RMSEA, NNFI, IFI, CFI) indicated that the scale model had a good fit (Tabachnick & Fidell 2007), while the SRMR, AGFI, and GFI fit indices indicated that the model had an acceptable fit (Kline, 2016; Schermelleh-Engel et al., 2003). These results confirm the factor structure of the scale.
A second-order CFA was conducted to determine the structural relationship between the scale and the sub-factors. The results in Table 5 indicate that the standardised factor loadings of the first-order latent variables in the model ranged from.22 to.59, and the t-test results were significant (p <.01). All of the fit indices for the 2nd-order after structural modification in Table 6 (= 373.25, df = 269, = 1.39, RMSEA =.051, NNFI =.98, IFI =.98, GFI =.83, CFI =.98, AGFI =.80, and SRMR =.084) confirmed that the model had a good and acceptable fit (Çokluk et al., 2012; Kline, 2016).
Figure 2. Path diagram related to the first-order CFA (standardised factor loads)

Table 4. Fit indices related to first- and second-order CFA of the scale.
|
Fit Index |
x2 / df |
RMSEA |
IFI |
GFI |
AGFI |
CFI |
NNFI |
SRMR |
|
Good Fit Criteria |
≤.3 |
≤.05 |
≥.95 |
≥.95 |
≥.90 |
≥.95 |
≥.95 |
≤.05 |
|
Acceptable Fit Criteria |
≤.5 |
≤.08 |
≥.90 |
≥.80 |
≥.80 |
≥.90 |
≥.90 |
≤.08 |
|
First-order CFA result |
1.35 |
.048 |
.98 |
.84 |
.80 |
.98 |
.98 |
.060 |
|
2nd-order CFA result |
1.39 |
.051 |
.98 |
.83 |
.80 |
.98 |
.98 |
.084 |
Table 5. Factor loadings in the 2nd-order CFA for the scale model.
|
2nd-Order Variable |
First-Order Variable |
Factor load |
Error Variance |
t-value |
R2 |
|
Assessment Methods |
F1. Alternative assessment methods |
.59 |
.65 |
3.79 |
.350 |
|
F2. Objective assessment methods |
.28 |
.36 |
2.29 |
.076 |
|
|
F3. Performance assessment methods |
.66 |
.57 |
3.93 |
.430 |
|
|
F4. Traditional assessment methods |
.22 |
.95 |
2.00 |
.050 |
3.4. Results of Convergent and Discriminant Validity
Convergent and discriminant validity are two fundamental aspects of construct validity. Convergent validity describes the degree to which the new scale is related to other variables and other measures of the same construct (Hair et al., 2010). The construct should correlate not only with similar, related factors but also with dissimilar, unrelated factors. Convergent validity was assessed using the average variance extracted (AVE). AVE indicates the average percentage of variation explained (variance extracted) by the items of a construct (Hair et al., 2014). According to Fornell and Larcker (1981), convergent validity is established when the AVE is greater than or equal to.50. The results in Table 6 showed that the AVE values for sub-factors were.511 (F1),.798 (F2),.712 (F3) and.745 (F4) respectively, confirming the convergent validity.
Table 6. Reliability, convergent, and discriminant validity results.
|
Variable |
Cronbach’s Alpha |
AVE |
CR |
F1 |
F2 |
F3 |
F4 |
|
F1. Alternative assessment methods |
.958 |
.745 |
.958 |
.863a |
.12 |
.41** |
.09 |
|
F2. Objective assessment methods |
.867 |
.511 |
.859 |
.715a |
.15* |
.38** |
|
|
F3. Performance assessment methods |
.946 |
.712 |
.944 |
.844a |
.11 |
||
|
F4. Traditional assessment methods |
.940 |
.798 |
.940 |
.893a |
Note: AVE = Average Variance Extracted, CR = Composite Reliability, aDiagonal elements (in bold) represent the square root of AVE, *p <.05, **p <.01
Discriminant validity was established to determine the distinctiveness of the constructs in the scale. Discriminant validity indicates that construct measures that theoretically should not be highly correlated, are not related to each other (Hair et al., 2014). Discriminant validity was assessed by comparing the square root of the AVE with the correlations between the constructs. If the AVE of both constructs is greater than the squared correlation, then discriminant validity is confirmed (Fornell & Larcker, 1981). Table 6 shows that there were no high inter-correlations between the constructs of the scale, which ranged from.09 to.41. In addition, the square root of the AVE values for each construct, which ranged from.715 to.893, was found to be higher than the inter-constructs correlation. These results confirmed the discriminant validity of the sub-factors.
3.5. Results of Reliability Analysis
In this study, Cronbach’s alpha reliability and Composite reliability (CR) coefficients were calculated to determine the internal consistency of the scale. According to Fornell and Larcker (1981), CR is an indicator of the shared variance among the observed variables used as indicators of a latent construct. It is suggested that the reliability coefficient for the scales is higher than.70 (Field, 2005). As can be seen in Table 6, Cronbach’s alpha coefficient for the sub-factors was calculated to be.958 (F1),.867 (F2),.946 (F3), and.940 (F4), respectively. The Cronbach’s alpha coefficient of the total scale was found to be.91. The CR values for the sub-factors were found to be.958,.859,.944, and.940 respectively. These results indicated that the scale has a high internal consistency reliability.
4. Discussion and Conclusion
The purpose of this study was to develop a scale to assess the frequency of mathematics teachers’ use of classroom assessment tools and methods. A draft scale of 29 items was developed after reviewing previous studies and taking into account the opinions of experts in the field and teachers. In the first phase of this study, EFA was conducted with 170 teachers to assess the construct validity of the scale. The Kaiser-Meyer-Olkin (KMO) value for the suitability of EFA was.767, and the chi-square value for Bartlett’s sphericity test was 1753.17 (p <.001). These results demonstrated the feasibility of the EFA (Tabachnick & Fidel, 2007). Factor analysis was carried out using principle component analysis and the promax rotation method. The sub-factors were determined by ensuring that the factor loading of the items was at least.40 (Çokluk et al., 2012). The results of the first-factor analysis revealed a seven-factor scale with eigenvalues greater than one. Four items were removed from the analysis because their factor loadings were less than.40 or had cross-loadings. Repeating the factor analysis on the remaining 25 items extracted a four-factor scale with an eigenvalue greater than 1.5, whose factor loadings ranged from.51 to.85, and explained 52.38 % of the variance. In the social sciences, the variance explained in multifactor scales is accepted to be between 40 % and 60 % (Tabachnick & Fidel, 2007). These results indicate that the sub-factors of the scale and its related items are sufficient to explain the frequency of use of classroom assessment tools and methods for mathematics teachers.
For the item analysis, the item-total correlation was calculated and the t-test was used to determine the item discrimination for the 27 % upper and lower groups. For scale development studies, it is recommended that item-total correlation values should be greater than.30 and that items with values less than.20 should be removed from the scale (Çokluk et al., 2012). The item-total correlation values of the scale in the current study ranged from.31 to.65, and the t-test results for the upper (27 %) and lower (27 %) groups were significant (p <.01). These results showed that the discrimination of the scale items was within an acceptable range (Field, 2005).
The sub-factors of the scale that emerged from the result of EFA were named “traditional assessment methods”, “objective assessment methods”, “performance assessment methods” and “alternative assessment methods” based on the characteristics of the items. The Turkish mathematics curriculum suggests that assessment practices should be carried out for Assessment of Learning (AoL), Assessment for Learning (AfL), and Assessment as Learning (AaL) and that alternative assessment techniques should be used in the learning process (MoNE, 2018). Considering this aspect, it can be stated that the scale factors and items developed are appropriate for the mathematics curriculum. Furthermore, the sub-factors of this scale developed for mathematics teachers are similar to some previous studies (e.g., Bol et al., 1998; Cizek et al., 1995; Gelbal & Keleciolu, 2007; McMillan et al., 2002; Nazlıçicek & Akarsu, 2008). For example, a three-factor scale developed by Nazlçiçek and Akarsu (2008) includes “traditional assessment methods” (e.g., written exam, test, quiz, homework, open-ended question) and “alternative assessment methods” (e.g., portfolio, project, observation, concept map, laboratory reports, self-assessment). Peker and Gülle (2011) developed a three-factor scale with “homework type assessment tools”, “classical assessment tools” and “alternative assessment tools”. The scale developed by Çalışkan and Kaşıkçı (2010) for social studies teachers has sub-factors including “objective assessment tool” (e.g., open-ended test, short-answer, matching item, oral exam) and “alternative assessment tool” (e.g., performance task, portfolio, portfolio, word association). Unlike previous studies, some sub-factors and items that emerged in this study differed from those in previous studies (e.g., Bol et al., 1998; Büyüktokatlı & Bayraktar, 2014; McMillan, 2001; McMillan et al., 2002; Nazlıçiçek and Akarsu, 2008; Peker & Gülle, 2011; Yıldırım Ekinci & Köksal, 2011). This result can be explained by the differences in grade level and pedagogical approach of the curriculum adopted in the countries, as well as the assessment tools preferred by mathematics teachers and other subject teachers (e.g., Turkish, social studies, English, and science). In this respect, the scale in the current study contributes to the existing literature.
In the second stage of this study, first- and second-order CFAs were conducted with 150 mathematics teachers to assess the construct validity of the scale. After the proposed modification, the results of the first-order CFA (= 1.35, RMSEA =.048, IFI =.98, GFI =.84, CFI =.98, NNFI =.98) indicated that the model’s fit indices were good or acceptable (Çokluk et al., 2012; Kline, 2016; Tabachnick & Fidell, 2007). The fit indices of the model were found to be acceptable as a result of the second-order CFA (= 1.39, RMSEA =.051, IFI =.98, GFI =.83, CFI =.98, NNFI =.98). These results supported the four-factor structure of the scale. Convergent and discriminant validity was also established using average variance extracted (AVE) and composite reliability (CR) coefficients (Fornell & Larcker, 1981). Discriminant validity was assessed by comparing the square root of the AVE with the inter-construct correlations. The AVE values for the sub-factors, which ranged from.51 to.79 and were greater than.50, provided evidence of convergent validity. Discriminant validity was supported by the square root of the AVE values for sub-factors, which ranged from.715 to.893 and were higher than the inter-construct correlation.
The Cronbach’s alpha and the CR values were calculated to determine the internal consistency. It should be noted that Cronbach’s alpha and the CR values were greater than.70 (Çokluk et al., 2012). The Cronbach’s alpha values were determined to be.91 (total scale),.958 (F1),.867 (F2),.946 (F3), and.940 (F4), respectively. The CR values were determined to be.958 (F1),.859 (F2),.944 (F3), and.940 (F4). These results showed that the total scale and the sub-factors had satisfactory internal consistency.
In this current study, a scale of 25 items and 4 sub-factors was developed. According to the results of this study, the scale is valid and reliable for measuring the frequency of using classroom assessment tools and methods for mathematics teachers. The sample of this study is limited to Turkish middle and high school mathematics teachers. Therefore, the validity of this scale can be verified by administering it to teachers in countries other than Türkiye. In future research, in addition to determining the frequency of mathematics teachers’ use of classroom assessment methods, the factors that influence the frequency of use of assessment methods can be investigated using quantitative statistical approaches. Furthermore, the reasons for the frequency of teachers’ use of assessment tools and methods can be explored in detail by using qualitative research techniques.
Acknowledgments
This study is derived from the second author’s Master’s thesis.
Ethical standard statement
Research ethics approval was obtained from the Ethics Committee for Scientific Research and Publication of Usak University (date: 08.03.2022, decision no: 2022-09).
Disclosure statement
No potential conflict of interest was reported by the authors
5. References
, & (2018). Classroom assessment practices of teachers in Turkey. International Journal of Instruction, 11(3), 587-602. https://doi.org/10.12973/iji.2018.11340a
, & (1998). Classroom assessment: Teachers’ conceptions and practices in mathematics. School Science and Mathematics, 98(4), 174-180. https://doi.org/10.1111/j.1949-8594.1998.tb17413.x
, & (2017). The impact of formative assessment on student achievement: A study of the effects of changes to classroom practice after a comprehensive professional development programme. Learning and Instruction, 49, 92-102. https://doi.org/10.1016/j.learninstruc.2016.12.006
(2020). An examination of secondary school mathematics teachers’ approaches, perception of proficiency and their frequency of use about alternative assessment tools and methods (Unpublished Master’s thesis). Usak University.
(2022). Prioritising students in Assessment for Learning: A scoping review of research on students’ classroom experience. Review of Education, 10(3), e3366. https://doi.org/10.1002/rev3.3366
Assessment Reform Group (1999). Assessment for learning: Beyond the black box. Cambridge, England: University of Cambridge.
, , & (2020) Portfolios as a tool for AfL and student motivation: are they related?, Assessment in Education: Principles, Policy & Practice, 27 (4), 444-462. https://doi.org/10.1080/0969594X.2019.1653824
(2010). Teachers’ implementation level of assessment and evaluation approaches suggested by 4-5th grade mathematics curricula (Unpublished doctoral dissertation). Karadeniz Technical University.
, & (2009). An investigation of primary school teachers’ proficiency perceptions about measurement and assessment methods: The case of Turkey. Procedia Social and Behavioral Sciences, 1(1), 681-685. https://doi.org/10.1016/j.sbspro.2009.01.119
, & (2012). Investigation of the purposes of the measurement and assessment practice of primary school teachers within the context of the new mathematics curriculum. Education and Science, 5(1), 7-74.
, & (2018). Classroom assessment and pedagogy. Assessment in Education: Principles, Policy & Practice, 25(6), 551-575. https://doi.org/10.1080/0969594X.2018.1441807
, & (1998). Assessment and classroom learning. Assessment in Education: Principles, Policy & Practice, 5(1), 7-74. https://doi.org/10.1080/0969595980050102
, , , & (1998). Influence of experience, grade level, and subject area on teachers’ assessment practices. The Journal of Educational Research, 91(6), 323-330. https://doi.org/10.1080/00220679809597562
, & (2014). Alternative assessment practices in science. Pegem Journal of Education and Instruction, 4(1), 103-126. https://doi.org/10.14527/pegegog.2014.006
, & (2010). The application of traditional and alternative assessment and evaluation tools by teachers in social studies. Procedia-Social and Behavioral Sciences, 2(2), 4152-4156. https://doi.org/10.1016/j.sbspro.2010.03.656
, & (2015). Teachers’ grading decision making: multiple influencing factors and methods. Language Assessment Quarterly, 12, 213-233. https://doi.org/10.1080/15434303.2015.1010726
, , & (1995). Teachers’ assessment practices: preparation, isolation, and the kitchen sink. Educational Assessment, 3(2), 159-179. https://doi.org/10.1207/s15326977ea0302_3
(2012). Formative assessment: Assessment is for self-regulated learning. Educational Psychology Review, 24(2), 205-249. https://doi.org/10.1007/s10648-011-9191-6
, , & (2012). Sosyal bilimler için çok değişkenli istatistik SPSS ve LISREL uygulamaları [Multivariate statistics SPSS and LISREL applications for social sciences] (2nd Edition). Ankara: Pegem Academy Publishing.
,, , & (2018). Student perspectives on assessment for learning. The Curriculum Journal, 29(1), 77-94. https://doi.org/10.1080/09585 176.2017
, & (2007). Factors affecting teachers’ grading and assessment practices. Alberta Journal of Educational Research, 53(1), 1-21. https://doi.org/10.11575/ajer.v53i1.55195
,, & (2013). The competency level of elementary school teachers’ towards the alternative assessment methods. Mehmet Akif Ersoy University Journal of the Institute of Educational Sciences, 2(2), 26-37.
(2012). Assessment as learning: Using classroom assessment to maximize student learning. Thousand Oaks, CA: Corwin Press.
(2005). Discovering statistic using SPSS for Windows (2nd edition). London: Sage Publication.
, & (1981). Evaluating structural equation models with unobservable variables and measurement error. Journal of Marketing Research, 18(1), 39-50.
(1996). Constructivism: Theory, perspectives, and practice. New York, NY: Teachers College Press.
, & (2007). Teachers’ proficiency perceptions of about the measurement and evaluation techniques and the problems they confront. Hacettepe University Journal of Education, 33, 135-145.
, & (2009). The multiple uses of assessment methods in 4th and 5th grades and the competency levels of teachers. Education and Science, 34(153), 127-143. Retrieved from http://egitimvebilim.ted.org.tr/index.php/EB/article/view/579
, , , & (2010). Multivariate data analysis (7th Edition). New York: Pearson.
, & (2018). Reaping the benefits of assessment for learning: Achievement, identity, and equity. ZDM Mathematics Education, 50 (4), 729-741. https://doi.org/10.1007/s11858-018-0943-3
, & (2011). Formative assessment: a meta-analysis and a call for research. Educational Measurement: Issues and Practice, 30(4), 28-37. https://doi.org/10.1111/j.1745-3992.2011.00220.x
(2009). Assessment for learning revisited: An Asia-Pacific perspective. Assessment in Education, 16(3), 263-268. https://doi.org/10.1080/09695940903319646
(2016). Principles and practice of structural equation modeling (4th edition). New York: The Guilford Press.
(2002). A revision of Bloom’s Taxonomy: An overview. Theory Into Practice, 41(4), 212–218. https://doi.org/10.1207/s15430421tip4104_2
, , , & (2019). Students’ formative assessment perceptions, feedback use and mathematics performance in secondary schools in Tanzania. Assessment in Education: Principles, Policy & Practice, 26(3), 278-302. https://doi.org/10.1080/0969594X.2019.1593103
(2016). Assessment as learning: Examining a cycle of teaching, learning, and assessment of writing in the portfolio-based classroom. Studies in Higher Education, 41(11), 1900-1917. https://doi.org/10.1080/03075079.2014.999317
, , , & (2011). Does assessment for learning make a difference? The development of a questionnaire to explore the student response. Assessment & Evaluation in Higher Education, 36(7), 749-765. https://doi.org/10.1080/02602938.2010.488792
(2001). Secondary teachers’ classroom assessment and grading practices. Educational Measurement: Issues and Practice, 20(1), 20-32. https://doi.org/10.1111/j.1745-3992.2001.tb00055.x
(2013). Classroom assessment: Principles and practice for effective standards-based instruction (6th edition). New York: Pearson.
, , & (2002). Elementary teachers’ classroom assessment and grading practices. The Journal of Educational Research, 95(4), 203-213. https://doi.org/10.1080/00220670209596593
Ministry of National Education (MoNE) (2013). Ortaokul matematik dersi (5, 6, 7 ve 8. Sınıflar) öğretim Programı [Middle school mathematics curriculum (5th, 6th, 7th and 8th grades)]. Ankara: MoNE.
Ministry of National Education (MoNE). (2014). Milli Eğitim Bakanlığı okul öncesi eğitim ve ilköğretim kurumları yönetmeliği [Ministry of National Education regulation on pre-school education and primary education institutions]. Ankara: MoNE
Ministry of National Education (MoNE). (2018). Matematik dersi öğretim programı (İlkokul ve ortaokul 1-8. Sınıflar) [Primary school mathematics curriculum (1st-8th grade)]. Ankara: MoNE
, , & (2016). 20 years of TIMSS international trends in mathematics and science achievement, curriculum, and instruction. TIMSS & PIRLS International Study Cente, and IEA.
National Council of Teachers of Mathematics (NCTM) (2000). Principles and standards for school mathematics. Reston, VA: Author.
National Council of Teachers of Mathematics (NCTM) (2020). Standards for the Preparation of Secondary Mathematics Teachers. Reston, VA: Author.
, & (2008). Physics, chemistry and mathematics teachers’ approaches to assessment tools and their assessment practices. Education and Science 33(149), 18-29.
, & (2015). Exploring primary school teachers’ competencies of alternative assessment and evaluation. Elementary Education Online, 14(3), 914-933. http://dx.doi.org/10.17051/io.2015.22900
, & (2011). Mathematics teachers’ level of knowing about the measurement tools in new elementary school mathematics teaching program and their frequency of use. Elementary Education Online, 10(2), 703-716.
, & (2010). Examining the grading practices of teachers. Teaching and Teacher Education, 26(7), 1372-1380. https://doi.org/10.1016/j.tate.2010.03.008
, & (2017). Integrating assessment as, for, and of learning in a large-scale exam preparation course. Assessing Writing, 34, 50-61. https://doi.org/10.1016/j.asw.2017.09.003
, , , , , & (2021). A scoping review on the notions of Assessment as Learning (AaL), Assessment for Learning (AfL), and Assessment of Learning (AoL). Studies in Educational Evaluation, 71, 101094. https://doi.org/10.1016/j.stueduc.2021.101094
, , &(2003). Evaluating the fit of structural equation models: Tests of significance and descriptive goodness-of-fit measures. Methods of Psychological Research Online, 8(2), 23-74.
(2000). The role of assessment in a learning culture. Educational Researcher, 29(7), 4-14. https://doi.org/10.3102/0013189X029007004
(1997). Student-centered classroom assessment (2nd ed.). Upper Saddle River, NJ: Prentice-Hall
, & (2014). Teachers’ grading practices: Meaning and values assigned. Assessment in Education: Principles, Policy & Practice, 21(3), 326-343. https://doi.org/10.1080/0969594X.2013.768207
, & (2007). Using multivariate statistics (5th ed.). New York: Allyn & Bacon/Pearson Education.
(2011). What is assessment for learning? Studies in Educational Evaluation, 37, 3-14. http://dx.doi.org/10.1016/j.stueduc.2011.03.001
(2011). What is assessment for learning?. Studies in Educational Evaluation, 37(1), 3-14. https://doi.org/10.1016/j.stueduc.2011.03.001
, & (2014). Elementary 6-8 grades teachers’ frequency of use and their level of adequacy in assessment and evaluation methods: Erzurum sampling. Necatibey Faculty of Education, Electronic Journal of Science and Mathematics Education, 8(2), 164-197. https://doi.org/10.17522/nefefmed.65358
, & (2011). Development of elementary science and mathematıcs teachers’ competence in measurement and evaluation scale. Kastamonu Education Journal, 19, 167-184. Retrieved from https://dergipark.org.tr/tr/pub/kefdergi/issue/49053/625830
(2020). Classroom assessment practices and student goal orientations in mathematics classes. Journal of Qualitative Research in Education, 8(1), 294-323. https://doi.org/10.14689/issn.2148-2624.1.8c.1s.13m
, & (2003). Classroom assessment practices and teachers’ self-perceived assessment skills. Applied Measurement in Education, 16(4), 323-342. https://doi.org/10.1207/S15324818AME1604_4