Análisis factorial exploratorio: Medición de la financiación ecológica de las empresas en Indonesia
Exploratory Factor Analysis: Measurement Of Company Green Finance in Indonesia
Syarief Gerald Prasetya
Universitas Binaniaga Indonesia (Indonesia)
https://orcid.org/0009-0006-5859-8764
RESUMEN
El objetivo de este estudio es probar la aplicación del análisis factorial para medir la aplicación de las finanzas verdes en Indonesia. Esta investigación emplea el análisis factorial exploratorio (AFE) para examinar el conjunto de datos con el fin de descubrir relaciones complejas entre los elementos y grupos de elementos que constituyen un concepto integrado. La nueva medición de las finanzas verdes de este estudio representa un paso transformador hacia un futuro más ecológico y equitativo, e incluye pruebas de validez, fiabilidad, adecuación muestral, Kaiser-Meyer-Olkin (KMO) y esfericidad de Bartlett. Los proyectos de conservación, las inversiones sostenibles y las energías renovables son los factores clave extraídos mediante el método de la matriz de componentes rotados para medir la aplicación de la financiación ecológica. El análisis factorial utilizado para medir las finanzas verdes requiere una evaluación holística que tenga en cuenta la relación entre los factores medioambientales, sociales y económicos. Los indicadores de finanzas verdes son métricas de criterios específicos utilizados para evaluar el impacto medioambiental y sostenible de las iniciativas de gestión financiera. Los indicadores resultantes ayudan a evaluar la eficacia con que se asignan fondos a proyectos, empresas y prácticas respetuosos con el medio ambiente. La perspectiva de este estudio presenta un modelo de medición cuantitativa destinado a evaluar la idoneidad de las prácticas de finanzas verdes en Indonesia.
PALABRAS CLAVE
Análisis Factorial Exploratorio; Finanzas Verdes; Inversiones Sostenibles; Indonesia.
ABSTRACT
The aim of this study is to test the application of factor analysis to measure the implementation of green finance in Indonesia.This research employs exploratory factor analysis (EFA) to examine the dataset in order to uncover complex relationships between items and groups of items that constitute an integrated concept. The new Green Finance measurement in this study represents a transformative step towards a greener and more equitable future, involving Validity Test, Reliability Test, Measure of Sampling Adequacy Test, Kaiser-Meyer-Olkin (KMO) Test, and Bartlett’s Test of Sphericity. Conservation projects, sustainable investments, and renewable energy are the key factors extracted using the Rotated Component Matrix method to measure green finance implementation. Factor analysis used in measuring green finance requires a holistic evaluation that considers the relationship between environmental, social and economic factors. Green finance indicators are metrics of specific criteria used to assess the environmental and sustainable impact of financial management initiatives. The resulting indicators help evaluate how effectively funds are allocated to environmentally friendly projects, businesses and practices. This study’s perspective presents a quantitative measurement model aimed at assessing the suitability of green financial practices in Indonesia.
KEYWORDS
Exploratory Factor Analysis; Green Finance; Sustainable Investments; Indonesia.
Clasificación JEL: Q56, G28, C38.
MSC2010: 91B64, 62H30, 91B44.
1. INTRODUCTION
Indonesia’s commitment to implementing green finance relates to the launch of the Indonesian Green Taxonomy on 20 January 2022, as a guide to promote information transparency in the Financial Services sector and as a reference for encouraging innovation in sustainable financial products and services, an element crucial to this concept is the development of revolutionary and economically acceptable financing or project funding schemes. Current research on green finance is mostly focused on the theoretical aspects of definitions, history and government policies in the field of green finance. However, according to Lindenberg N (2013), until now there has been no consensus regarding the definition of green finance. The results of previous studies such as Falcone & Sica, (2019) and Kissinger et al., (2019) cannot be ruled out as hasanah in understanding relevant theories of green finance. However, to encourage a deeper understanding of green finance, an in-depth study of the measurement aspects of green finance is needed. Measurement of a rational green finance construct can be studied by comparing the dynamic relationship of factors influencing green finance constructs in various countries, which helps in the measurement and evaluation of the green finance development process in Indonesia.
This research analysis primarily centered on the utilization of factor analysis, a multivariate statistical technique employed to discern the relatively strong relationships among variables within subsets, as described (Tabachnick and Fidell, 2013). The objective of this research was to employ factor analysis as a means of condensing a large array of interrelated measures into a set of representative constructs or factors, which can subsequently be used for further examination. Numerous studies have previously explored the utility of factor analysis as a method to reduce extensive datasets and identify the resultant factors (MacCallum et al., 1999).
Within the context of the green finance industry, assessing the degree of implementation involves various parameters. Factor analysis can categorize these variables into distinct factors, each of which gauges different facets of green finance implementation. The extraction of significant factors serves the purpose of elucidating the maximum variation within the study group. The application of factor analysis offers valuable insights for decision-makers, enabling them to concentrate on a select number of primary factors from the numerous parameters at hand, thereby guiding policy development.
The update in this study was obtained from the search results for articles with the keyword Green Finance, it is known that there are still very limited studies on measuring the implementation of green finance in various countries using a questionnaire survey method using factor analysis. The question of this research is how to test the application of factor analysis on questionnaire items to measure the implementation of green finance? Therefore, to identify these factors, it is important to understand the concept and steps for applying factor analysis to a questionnaire survey.
2. REVIEW OF LITERATURE
2.1. Green Finance
Currently, there is no universally accepted definition of green finance, as definitions in the literature vary widely (Ozili, 2022; Bhatnagar & Sharma, 2022). The OECD defines green finance as a means of achieving economic growth while reducing pollutant emissions, minimizing waste, and improving resource efficiency (Afzal, Rasoulinezhad, & Malik, 2022). More broadly, green finance refers to financial investments flowing into sustainable development projects, environmental products, and policies that foster sustainable economic development (Wang et al., 2022; Yu et al., 2022).
Green finance encompasses financing for climate-related actions and broader environmental objectives, including industrial pollution reduction, water sanitation provision, and biodiversity protection (Sun & Chen, 2022; Zhao et al., 2022). Mitigation and adaptation financing are particularly related to climate change. Mitigation refers to investments that reduce or avoid greenhouse gas emissions, while adaptation involves investments that reduce the vulnerability of economies and societies to the impacts of climate change (Muhammad & Hoffmann, 2024).
Research suggests that green finance is often used interchangeably with green investment, but in practice, it encompasses both investments and operational costs, such as project preparation and land acquisition (Ozili, 2022). For example, PricewaterhouseCoopers (PWC) emphasizes that green finance products in the banking sector integrate environmental factors into lending decisions, ex-post monitoring, and risk management to promote low-carbon technologies and sustainable industries (Afzal et al., 2022).
The People’s Bank of China (PBoC) defines green finance as financial services aimed at supporting economic activities that enhance the environment, mitigate climate change, and improve resource efficiency (Sun & Chen, 2022).
In Indonesia, the Financial Services Authority (OJK), through its Indonesian Green Taxonomy (2022), defines green finance as part of a political and institutional arrangement designed to attract private investment in green industries using various financial services including loans, private equity, bonds, stocks, and insurance. This reflects a broader trend in evolving green finance definitions as a diverse set of tools and instruments supporting environmentally friendly technologies, projects, industries, and companies (Afzal et al., 2022; Wang et al., 2022).
Green finance taxonomy refers to a framework for classifying financial activities that contribute to sustainable and low-carbon development. It includes setting clear criteria and standards to identify green financial products, sustainable projects, and environmentally responsible investments (Bhatnagar & Sharma, 2022; Zhao et al., 2022; Prasetya et al.,2024). Indonesia’s efforts align with global initiatives such as the EU Sustainable Finance Taxonomy, which offers a model for providing clear classification standards (Afzal et al., 2022).
Growing research in the field of green finance emphasizes its critical role. Ozili (2022) notes that green finance supports environmental decision-making, including lending, monitoring, and risk management to promote low-carbon economies. The development of green financial instruments such as green bonds has proven reliable and measurable for various stakeholders (Liu et al., 2023). Thus, green finance represents a modern evolution in finance that ensures national security by reducing poverty, conserving resources, creating jobs, and supporting a sustainable globalization framework (Yu et al., 2022; Muhammad & Hoffmann, 2024).
2.2 Green Financial Instruments
Green financial instruments play a crucial role in ensuring social and ecological security, as financial products are essential for driving the social and environmental transformation needed to end the excessive and imbalanced use of global environmental resources. These instruments should be categorized into the following segments: bank loans, corporate finance, green funds, and green insurance.
Green finance refers to financial products and services designed to support sustainable development and address environmental challenges. In operational concepts, green finance incorporates environmental, social, and governance (ESG) criteria into investment decisions and promotes capital allocation towards environmentally friendly projects and businesses. Green finance encourages:
Green Investment: Investment in corporate projects that promote environmental sustainability, including renewable energy projects, energy-efficient infrastructure, sustainable agriculture, waste management, and clean technology.
Green Bonds: Green bonds are debt instruments issued by governments, corporations, or financial institutions to raise funds for environmentally friendly projects. The proceeds from green bonds are specifically allocated to finance green initiatives, such as renewable energy installations or sustainable building projects.
ESG Integration: Environmental, social, and governance factors are integrated into investment analysis and decision-making processes. Investors assess environmental impact, social responsibility, and corporate governance practices before making investment choices.
Sustainability-Linked Loans: These are loans offered to companies with interest rates tied to their environmental performance or sustainability targets. Companies achieving predetermined sustainability goals may receive financial incentives, such as reduced interest rates.
Green Funds and Exchange-Traded Funds (ETFs): Green funds pool investments from multiple investors to finance green projects and businesses. Green ETFs are investment funds that track the performance of a portfolio of green stocks or bonds, allowing investors exposure to a diversified portfolio of environmentally friendly assets.
Reporting and Disclosure: Green finance emphasizes transparency and disclosure of environmental and social impacts. Companies and financial institutions are encouraged to report their ESG performance and disclose relevant information to investors and stakeholders.
Regulatory Initiatives: Governments and regulatory bodies increasingly implement policies and regulations to promote green finance. These may include tax incentives, subsidies, and mandatory reporting requirements for ESG factors.
The goal of green finance is to mobilize financial resources to address environmental challenges, support sustainable development, and promote the transition to a low-carbon and resource-efficient economy. By integrating environmental aspects into corporate financial decision-making, green finance is oriented towards creating positive environmental outcomes while generating financial returns. According to Lindenberg N. (2013) in Definition of Green Finance – Proposal for the BMZ, green finance consists of three key components:
•Public and Private Green Investment Financing: This includes preparation and capital costs in environmental goods and services sectors (e.g., water management or biodiversity and landscape protection) and in the prevention, minimization, and compensation of environmental and climate damage (e.g., energy efficiency or dams).
•Public Green Policy Financing: This includes operational costs that encourage the implementation of mitigation or adaptation initiatives (e.g., feed-in tariffs for renewable energy).
•Green Financial System Components: These specifically address green investments, such as green climate funds or financial instruments for green investments (e.g., green bonds and structured green funds), including the legal, economic, and institutional framework conditions.
A primary tool in green finance is the green loan, provided by Green Banks, which have emerged in EU countries. Green loans target environmental projects related to agriculture, renewable energy sources, green industries, and more. Banks offer various green credit products: green loans for specific industrial borrowers, environmental protection projects, environmental rehabilitation and disaster prevention, resource processing projects, waste disposal and pollution prevention projects, renewable and clean energy projects, rural and urban water projects, energy conservation projects (eco-building), and energy-efficient transportation and environmental services projects. The green credit principles outlined by Cheberyako et al. (2017) are based on four main components: use of proceeds, project evaluation and selection process, revenue management, and reporting.
3. RESEARCH METHOD
The research sample was taken using non-probability sampling with purposive sampling method, with the following criteria:
PROPER rated company in 2022 with Gold, Green, Blue, Red and Black ratings. Registered (listing) on the Indonesian Stock Exchange in 2022 A total sample of 304 companies with gold, green, blue and red ratings listed on the Indonesia Stock Exchange were used as samples in the research. In this research, primary data was used by conducting a questionnaire survey with the help of a Google Form survey, aimed at company leaders and financial managers, with the rate of return or filling out the questionnaire only 47 respondents provided responses. Thus the response rate in this study was 15.4 % which was considered sufficient. According to Roscoe (1975) in a concept known as the “rule of thumb” which states that a sample size greater than 30 is often considered sufficient to assume a normal distribution or close to a normal distribution, especially in statistical analysis with the aim of testing hypotheses or predictions. Information regarding corporate identity presented by type of company is explained as follows:
Table 1. Respondent Profile Based on Company Type
|
The type of company |
Number of (people) |
Percentage (%) |
|---|---|---|
|
Banking |
4 |
8,51 |
|
Garments |
7 |
14,89 |
|
Agribusiness |
11 |
23,40 |
|
Automotive |
12 |
25,53 |
|
Gas and Oil |
10 |
21,28 |
|
Transportation |
3 |
6,38 |
|
Amount |
47 |
100,00 |
Table 2. Measurement Dimensions in Previous Green Finance Research
|
Source |
Measurement Dimensions |
Country |
|---|---|---|
|
Gilbert et. al (2012) |
Sustainable development projects, environmentally friendly products and sustainable economic policies |
Europe |
|
Zandek and Flyn, (2013) |
Operational cost of green investment |
United States |
|
Zeng, X. W (2014) |
Five dimensions and using the subjective method of expert judgment and objective method of measuring assets in various areas of finance |
China |
|
PWC (2013) |
Environmental investments, eco-friendly technologies, sustainable projects, low carbon industry and business |
North America, Europe, and Asia |
|
Akin et.al (2016) |
Financial friendliness index based on factor analysis and nonlinear weighting to compare levels of financial risk sharing and interstate support |
United States. |
|
Sabine Dörry & Christian Schulz (2018) |
Financial services, products, sustainability space and organization |
Luxembourg |
|
Hayat et.al (2018) |
The financial development index and energy prices are significantly related with energy consumption |
Pakistan |
|
Li et.al (2018) |
Green financial market performance index and green financial ecological index |
China |
|
Mohsin et.al (2020) |
Low carbon financial index |
China |
|
PBoC (2019) |
green financing, green investment and green society |
China |
|
Hof et. al (2012) |
Climate finance: adequacy, predictability, And justice. |
Developing Countries |
|
Bloomberg, 2017 |
Alternative energy Energy efficiency Pollution Prevention and Control Sustainable Water Green Building Climate Adaptation |
Developed and Developing Countries |
|
Measurement dimension hypothesis |
– Eco-friendly project – Prevention and control of pollution – Conservation and recycling – Climate change adaptation – Clean transportation –Clean energy |
In the table above, it can be seen from previous studies that researchers have used a variety of different green finance dimensions, this can indicate that there is still no agreement regarding the definition and measurement dimensions of green finance
Validity Test
The validity test aims to assess the validity of the indicators for measuring variables. A questionnaire is considered valid if the questions contained in it can describe the things that the questionnaire wants to measure (Ghozali, 2005). A valid measuring instrument will have a small error rate, so that the data collected is reliable. The test criteria used, if r-count > r-table (at a significance level of 0.05), it can be stated that the questionnaire items are valid.
Reliability Test
A reliability test, sometimes referred to as a consistency assessment, is a technique employed to gauge the degree of uniformity or steadiness of a questionnaire when serving as an indicator of a specific variable or concept. In the context of this investigation, the analysis employed for the reliability test was the Cronbach-Alpha coefficient, and it exceeded 0.7 in line with the guidelines outlined (Sekaran, 2010).
Factor Analysis
In contrast to prior research on the assessment of green finance, the following methodologies have been employed: Zeng et al. (2014) utilized the Analytic Hierarchy Process (AHP), Sabine and Schulz (2018) adopted a qualitative approach, and Li et al. (2018) applied multiple regression analysis. In this research, an exploratory factor analysis (EFA) is employed to scrutinize data collections in order to unveil intricate connections among the constituent items and item groups that constitute the overarching concept. EFA, known for its exploratory approach, does not make a clear distinction between independent and dependent variables. Instead, it amalgamates similar variables into coherent factors with the aim of revealing the underlying variables. The method solely relies on a data correlation matrix, as suggested (Noora, 2021). Within this investigation, principal component extraction is utilized in factor analysis to evaluate whether statements are indicative of distinct factors pertinent to the implementation of green finance. As per Hair et al. (2006), Principal Component Analysis (PCA) is a statistical procedure used to accentuate variations, wherein primary data components are computed, thereby highlighting significant patterns within the dataset. Factor analysis involves several important steps as follows (Thompson, 2004):
Correlation or Covariance Matrix: The first step is to calculate the correlation or covariance matrix of the dataset.
Deriving Eigenvalues and Eigenvectors: To obtain eigenvalues and eigenvectors, one can perform calculations using the correlation or covariance matrix. This is achieved through the equation Rv=λv, in which ‘v’ represents the eigenvector, ‘λ’ signifies the eigenvalue, and ‘R’ corresponds to the correlation or covariance matrix.
Determining the Quantity of Factors: Deciding how many factors to extract from the outcomes of the factor analysis involves using a “scree plot.” This plot illustrates the eigenvalues in relation to the factor number and identifies the juncture at which eigenvalues begin to decline significantly, often referred to as the “elbow point” on the plot.
Calculating Factor Loadings: Factor loadings relate the original variables to the latent factors. The factor weight (lij) for the Xi variable and the Fj factor is calculated as part of the factor loadings matrix. It involves eigenvectors, correlation matrices, and column vectors of factors loadings matrix:
e) Factor Rotation: Factor rotation is used to make factor analysis results easier to interpret by using factor loadings matrix transformation.
f) Interpretation of Results: After calculating the factor loadings, then interpret the factors found. Variables with high factor loadings on certain factors are considered to have a strong relationship with these factors.
g) Determining Factor Names: Giving names to factors based on interpretation of the variables that are most strongly connected to each factor.
h) Calculating the Proportion of Variance: by calculating the proportion of variance explained by each factor by adding up the squares of the factor loadings and dividing it by the total variance of the initial variable.
4. RESULTS AND DISCUSSION
4.1. Selection of indicators
Prior to conducting factor analysis, it is essential to choose and validate the indicators that will be employed. The initial indicator selection process involves subjecting them to validity and reliability assessments. The validity examination entails comparing the correlation value (r-count) with the critical r-table value at a significance level of α = 0.05, which was determined to be 0.361. The outcomes of the validity test are presented in the subsequent table.
Table 3. Validity Test Results
|
No. |
Indicator |
Correlation (r- count) |
Sign |
Information |
|---|---|---|---|---|
|
1. |
KH1 |
0,778 |
0,00 |
Valid |
|
2. |
KH2 |
0,526 |
0,00 |
Valid |
|
3. |
KH3 |
0,856 |
0,00 |
Valid |
|
4. |
KH4 |
0,718 |
0,00 |
Valid |
|
5. |
KH5 |
0,768 |
0,00 |
Valid |
|
6. |
KH6 |
0,681 |
0,00 |
Valid |
|
7. |
KH7 |
0,892 |
0,00 |
Valid |
|
8. |
KH8 |
0,664 |
0,00 |
Valid |
|
9. |
KH9 |
0,743 |
0,00 |
Valid |
|
10. |
KH10 |
0,765 |
0,00 |
Valid |
|
11. |
KH11 |
0,633 |
0,00 |
Valid |
|
12. |
KH12 |
0,707 |
0,00 |
Valid |
Source: primary data analysed, 2024
According to the findings from the validity test, it is evident that the correlation value (r-count) for each of the indicators surpasses the critical r-table value of 0.361. Therefore, it is reasonable to conclude that all the indicators employed in the study are indeed valid. Following the validation assessments, the reliability testing of all the indicators was pursued.
The reliability test involved comparing the Cronbach’s Alpha value with a threshold of 0.700. The detailed results of the reliability test are provided in the subsequent table:
Table 4. Reliability Test Results
|
Cronbach’s Alpha |
N of Item |
|---|---|
|
0,919 |
12 |
Source: primary data analysed, 2024
As indicated in the table above, the reliability test yielded a Cronbach’s Alpha value of 0.919. This value surpasses the threshold of 0.700, affirming that the measurement instrument, in this case, the questionnaire, is reliable and suitable for subsequent data analysis. The next step involves assessing the selection of indicators to determine the extent of correlation among the initial indicators. The correlation among these indicators can be observed within the correlation matrix representing the initial indicators. This assessment utilizes statistical tests, namely the Measure of Sampling Adequacy (MSA), the Kaiser-Meyer-Olkin (KMO) measure of sampling adequacy, and the Bartlett test of sphericity, which are elaborated upon below.
4.2. Measure of sampling adequacy (MSA)
The Measure of Sampling Adequacy (MSA) assessment is conducted to identify which indicators are suitable for further analysis, as not all indicators will be retained for subsequent analysis. This examination involves reviewing the MSA values for each indicator, which are found along the diagonal in the anti-image correlation matrix. If any of the initial indicators individually exhibit an MSA value below 0.5, they are eliminated and excluded from the subsequent analytical process. The process entails systematically removing indicators one by one, commencing with the ones having the smallest MSA values. Then, the remaining initial indicators that meet the specified criteria are re-evaluated until their MSA values reach the threshold of 0.5. The outcomes of the MSA test are presented in the table below.
Table 5. Measure of Sampling Adequacy Test Results
|
Anti-image Matrices |
|||||||||||||
|---|---|---|---|---|---|---|---|---|---|---|---|---|---|
|
KH1 |
KH2 |
KH3 |
KH4 |
KH5 |
KH6 |
KH7 |
KH8 |
KH9 |
KH10 |
KH11 |
KH12 |
||
|
Anti-image Correlation |
KH1 |
,726a |
|||||||||||
|
KH2 |
,243 |
,744a |
|||||||||||
|
KH3 |
–,216 |
–,449 |
,817a |
||||||||||
|
KH4 |
–,234 |
,004 |
,172 |
,906a |
|||||||||
|
KH5 |
,025 |
,181 |
–,088 |
–,177 |
,883a |
||||||||
|
KH6 |
–,178 |
–,193 |
,228 |
–,042 |
–,357 |
,861a |
|||||||
|
KH7 |
–,782 |
–,244 |
–,040 |
,005 |
–,205 |
,136 |
,715a |
||||||
|
KH8 |
,276 |
–,025 |
–,153 |
–,069 |
–,190 |
–,164 |
–,045 |
,840a |
|||||
|
KH9 |
–,003 |
,108 |
–,481 |
–,305 |
–,192 |
–,182 |
,375 |
,138 |
,773a |
||||
|
KH10 |
,199 |
,091 |
,100 |
,155 |
,050 |
–,107 |
–,602 |
–,245 |
–,509 |
,735a |
|||
|
KH11 |
,257 |
,153 |
–,163 |
–,068 |
,238 |
–,184 |
–,485 |
–,428 |
–,220 |
,534 |
,661a |
||
|
KH12 |
,440 |
,227 |
–,537 |
–,162 |
,197 |
–,086 |
–,471 |
,066 |
–,120 |
,223 |
,279 |
,743a |
|
Source: primary data analysed, 2024
From the table above the MSA values of the 12 indicators used can be seen in the diagonal matrix which shows that each indicator has an MSA value of more than 0.5. Thus, it can be concluded that the 12 indicators used are feasible or adequate for further analysis.
4.3. Kaiser-meyer-olkin (KMO) measure of sampling adequacy and bartlett test of sphericity
This analysis was carried out to evaluate the suitability of the sample by utilizing two criteria: the Kaiser-Meyer-Olkin (KMO) Measure of Sampling Adequacy index and the p-value associated with Bartlett’s Test of Sphericity. The assessment primarily focuses on the KMO value. If the KMO value falls within the range of 0.5 to 1 (or exceeds 0.5), and the p-value from Bartlett’s Test of Sphericity is below the predetermined significance level (α = 0.05), it indicates the appropriateness of applying factor analysis, and it is advisable to proceed with the analysis. The outcomes of this assessment, along with the respective values, are presented in the table provided below.
Table 6. KMO Test Results and Bartlett’s Test of Sphericity
|
Kaiser-Meyer-Olkin Measure of Sampling Adequacy. |
,777 |
|
|---|---|---|
|
Bartlett’s Test of Sphericity |
Approx. Chi-Square |
424,952 |
|
df |
66 |
|
|
Sig. |
,000 |
|
Source: primary data analysed, 2024
Based on the test results, the KMO value was 0.777 and the Bartlett’s Test of Sphericity significance value was 0.000, thus it can be concluded that factor analysis can be used or continued to simplify the collection of 12 indicators.
4.4. Factor formation
Having chosen the 12 indicators and ensured their eligibility for analysis, the subsequent phase involves constructing factors with the aim of uncovering the underlying structure that interconnects these indicators. The process of establishing these factors entails determining the quantity of factors and implementing factor rotation. The steps for forming this factor are described as follows:
Determining the number of factor
The determination of the optimal number of factors to be generated involves amalgamating various criteria to align with the characteristics of the research data. This analysis is executed with reference to the provided table.
Table 7. Total Variance Explained
|
Component |
Initial Eigenvalues |
Extraction Sums of Squared Loadings |
Rotation Sums of Squared Loadings |
||||||
|---|---|---|---|---|---|---|---|---|---|
|
Total |
% of Variance |
Cumulative % |
Total |
% of Variance |
Cumulative % |
Total |
% of Variance |
Cumulative % |
|
|
1 |
6,469 |
53,908 |
53,908 |
6,469 |
53,908 |
53,908 |
3,773 |
31,440 |
31,440 |
|
2 |
1,218 |
10,148 |
64,056 |
1,218 |
10,148 |
64,056 |
2,605 |
21,709 |
53,149 |
|
3 |
1,076 |
8,963 |
73,020 |
1,076 |
8,963 |
73,020 |
2,384 |
19,871 |
73,020 |
|
4 |
,776 |
6,467 |
79,486 |
||||||
|
5 |
,688 |
5,734 |
85,220 |
||||||
|
6 |
,535 |
4,462 |
89,682 |
||||||
|
7 |
,368 |
3,068 |
92,750 |
||||||
|
8 |
,313 |
2,612 |
95,362 |
||||||
|
9 |
,289 |
2,409 |
97,771 |
||||||
|
10 |
,154 |
1,286 |
99,057 |
||||||
|
11 |
,080 |
,670 |
99,727 |
||||||
|
12 |
,033 |
,273 |
100,000 |
||||||
Source: primary data analysed, 2024
By consolidating the initial indicators into 3 factors, a substantial cumulative total variance of 73.020 % was achieved. This implies that the 3 factors formed effectively encapsulate the 12 green financial indicators, elucidating approximately 73.020 % of the concept of green finance. Hence, it is confirmed that extracting the 3 factors aligns with the second criterion.
The third criterion involves ascertaining the number of factors using Scree plots. A Scree plot depicts the eigenvalues corresponding to the extracted factors, and the precise number of factors is determined by identifying the point where the Scree plot begins to exhibit a flattening pattern. The Scree Plot image is explained as follows:
Figure 1. Scree Plot
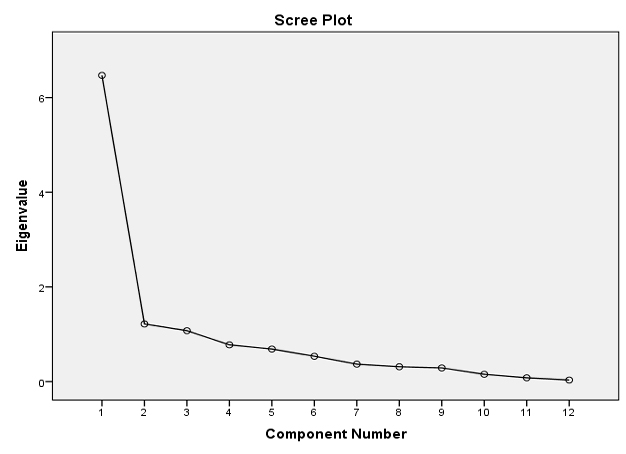
Source: primary data analysed, 2024
In the depicted graph, it’s evident that the Scree plot begins to plateau when extracting the initial indicators into 3 factors. Therefore, it can be deduced that the optimal factor extraction involves using 3 factors. From the aforementioned explanation, it’s apparent that all three criteria yield congruent results, indicating that the most suitable number of factors is indeed 3.
Communalities
Communality is basically the amount of variance of an indicator that can be explained by existing factors. Communality can be said to be the ability of indicators to explain factors. The greater the communality value, the higher the role of the indicator in explaining the factors formed. The table below shows the communality values of the indicators.
Table 8. Communalities
|
No. |
Variable |
Indicator |
Extraction |
|---|---|---|---|
|
1. |
Project |
KH1 |
,813 |
|
KH2 |
,622 |
||
|
KH3 |
,888 |
||
|
2. |
Pollution Prevention and Control |
KH4 |
,579 |
|
KH5 |
,783 |
||
|
3. |
Conservation and Recycling |
KH6 |
,711 |
|
KH7 |
,886 |
||
|
4. |
Clean Transportation |
KH8 |
,751 |
|
5. |
Clean Energy |
KH9 |
,610 |
|
KH10 |
,723 |
||
|
6. |
Climate Change Adaptation |
KH11 |
,696 |
|
KH12 |
,701 |
Source: primary data analysed, 2024
The numbers in the table show the magnitude of the variance of the indicators that can be explained by the factors formed. For example, the KH1 indicator has a correlation of 81.3 % to the formed factor, the KH2 indicator has a 62.2 % correlation to the formed factor and so on.
Component Matrix
The table depicting the component matrix visually presents the allocation of the 12 indicators among the three identified factors. In this component matrix, the values within it signify factor loadings, which reflect the degree of correlation between each indicator and the three distinct factors, specifically referred to as factor 1, factor 2, and factor 3. Below, you will find the Component Matrix table.
Table 9. Compenent Matrix
|
Component |
|||
|---|---|---|---|
|
1 |
2 |
3 |
|
|
KH1 |
,763 |
–,261 |
–,404 |
|
KH2 |
,522 |
,554 |
–,205 |
|
KH3 |
,871 |
,329 |
–,146 |
|
KH4 |
,714 |
–,250 |
,087 |
|
KH5 |
,768 |
–,419 |
,135 |
|
KH6 |
,673 |
–,320 |
,394 |
|
KH7 |
,885 |
–,042 |
–,317 |
|
KH8 |
,660 |
,206 |
,522 |
|
KH9 |
,761 |
–,029 |
,172 |
|
KH10 |
,765 |
–,295 |
–,224 |
|
KH11 |
,621 |
,382 |
,406 |
|
KH12 |
,731 |
,341 |
–,224 |
Source: primary data analysed, 2024
The table above explains that the correlation values of each indicator with the three factors formed include: (1) indicator KH1 with factor 1 correlation 0.763; with factor 2 correlation -0.261; with a correlation factor of -0.404, (2) KH2 indicator with a correlation factor of 1.522; with factor 2 correlation 0.554; with a factor 3 correlation -0.205, (3) KH3 indicator with a factor 1 correlation 0.871; with factor 2 correlation 0.329; with factor 3 correlation -0.146 and so on.
Rotation
The rotation matrix component is a correlation matrix that provides a more transparent and accurate representation of variable distribution compared to the component matrix. The generation of factors based on their constituent indicators can be observed through the outcomes of the Rotated Component Matrix test. The indicator that assumes the role of forming a factor is identified by the highest factor loading value. Below, you will find the Rotated Component Matrix table.
Table 10. Rotated Component Matrix
|
Component |
|||
|---|---|---|---|
|
1 |
2 |
3 |
|
|
KH1 |
,821 |
,373 |
–,010 |
|
KH2 |
,062 |
,769 |
,162 |
|
KH3 |
,436 |
,758 |
,351 |
|
KH4 |
,637 |
,148 |
,389 |
|
KH5 |
,771 |
,030 |
,432 |
|
KH6 |
,565 |
–,055 |
,623 |
|
KH7 |
,739 |
,562 |
,157 |
|
KH8 |
,176 |
,275 |
,803 |
|
KH9 |
,501 |
,301 |
,518 |
|
KH10 |
,793 |
,273 |
,142 |
|
KH11 |
,067 |
,435 |
,709 |
|
KH12 |
,353 |
,727 |
,217 |
Source: primary data analysed, 2024
To determine whether the grouping of indicators into each factor formed is appropriate or not, a significance test of the loading factor value has not been carried out. The test is carried out with the requirement that the factor loading value of 0.5 is considered significant.
The results of the analysis show that the indicators KH1, KH4, KH5 KH7 and KH10 have the highest loading factor value (> 0.5) in forming factor 1. Then the indicators KH2, KH3 and KH12 have the highest loading factor value (> 0.5) in forming factor 2. Meanwhile, indicators KH6, KH8, KH9 and KH11 have the highest loading factor value (0.5) in forming factor 3. Thus, the grouping of indicators into each factor is explained in the following table:
Table 11. Grouping of Indicators into Factors
|
Factor |
Indicator |
|---|---|
|
Factor 1 |
KH1, KH4, KH5, KH7, KH10 |
|
Factor 2 |
KH2, KH3, KH12 |
|
Factor 3 |
KH6, KH8, KH9, KH11 |
Source: primary data analysed, 2024
Factor Naming
After the formation of 3 factors, each of which consists of the initial indicators studied, the next step is to name the factors based on the characteristics that correspond to the members of each factor.
Factor 1
Members or indicators in factor 1 consist of projects supported by the company aiming to improve the welfare of the surrounding community (KH1), the company implements environmentally friendly technology and production processes to reduce pollutant emissions (KH4), the company routinely carries out monitoring and control pollution in its operations (KH5), the company actively supports recycling programs and the use of environmentally friendly raw materials (KH7) and the use of renewable energy is a top priority in company policy (KH10). By generalizing the four indicators, factor 1 is then referred to as the conservation project factor.
Factor 2
Members or indicators in factor 2 consist of companies investing in projects that support the development of environmentally friendly technologies (KH2), company projects actively considering positive impacts on the environment (KH3) and in making long-term decisions, companies consider factors -climate change factors (KH12). By generalizing the four indicators, factor 2 is then referred to as the sustainability investment factor.
Factor 3
Members or indicators in factor 3 consist of companies implementing energy and water conservation policies in their operations (KH6), companies prioritizing the use of more efficient and environmentally friendly transportation fleets (KH8), companies actively seeking ways to reduce energy consumption and improve energy efficiency in operations (KH9) and companies investing in research and technology that can help reduce vulnerability to climate change (KH11). By generalizing the four indicators, factor 3 is hereinafter referred to as the renewable energy factor.
Determine the accuracy of the factors
After determining the new factors, it is necessary to test the accuracy of the factors formed. To carry out the test, Component Transformation Matrix analysis is used which serves to prove the magnitude of the correlation value of the factors formed. Factor formation is said to be correct if the correlation of each factor is greater than 0.5. Based on the results of the analysis, the Component Transformation Matrix is obtained as shown in the table below:
Table 12. Component Transformation Matrix
|
Component |
1 |
2 |
3 |
|---|---|---|---|
|
1 |
,699 |
,519 |
,492 |
|
2 |
–,653 |
,743 |
,145 |
|
3 |
–,290 |
–,423 |
,858 |
Source: primary data analysed, 2024
The correlation value of each factor can be seen from the diagonal table above which is obtained: factor 1 correlation value 0.699, factor 2 correlation value 0.743 and factor 3 correlation value 0.858. These three factors are proven to have a correlation value greater than 0.5. Each factor has a positive relationship which is explained by the correlation value of each factor which is positive. With this test it can be concluded that the three factors formed are appropriate in summarizing the 12 existing indicators. Where based on these three factors is used to measure green finance.
4. Discussion
The three strategic factors identified in the implementation of sustainable business practices highlight a company’s commitment to environmental and social responsibility. The Conservation Project factor includes several indicators that reflect a company’s efforts to support community welfare improvement (KH1), apply environmentally friendly technologies to reduce emissions (KH4), and monitor and control pollution (KH5). Additionally, it includes support for recycling programs and the use of eco-friendly raw materials (KH7), as well as the prioritization of renewable energy in corporate policies (KH10). This factor underscores the company’s role in both environmental and social conservation, aligning with the principles of sustainable development, which integrate environmental and social welfare aspects into business operations. This concept is in line with initiatives such as Indonesia’s Low Carbon Development Initiative (LCDI), which emphasizes the importance of conservation programs and clean energy transitions to foster low-carbon economic growth.
The Sustainability Investment factor reflects the company’s strategic approach to supporting sustainable innovation. It includes indicators such as corporate investment in environmentally friendly technologies (KH2), consideration of positive environmental impacts in corporate projects (KH3), and long-term decision-making that integrates climate change factors (KH12). This factor highlights the company’s commitment to allocating resources in ways that promote sustainability and innovation over the long term.
The Renewable Energy factor includes several indicators related to energy efficiency and the transition to renewable energy sources. These indicators encompass energy and water conservation policies within operations (KH6), prioritization of efficient and eco-friendly transportation fleets (KH8), active efforts to reduce energy consumption and enhance efficiency (KH9), and investment in research and technology to address climate change vulnerabilities (KH11). This factor emphasizes the company’s role in driving energy efficiency and facilitating the shift to renewable energy sources, supporting Indonesia’s national target to achieve 5 % of electricity generation from renewable sources by 2025.
Table 13. Summary of Factor Characteristics
|
Factor |
Factor Name |
Variance Explained (%) |
General Description |
|---|---|---|---|
|
1 |
Conservation Project |
35.2 % |
Focus on social projects, environmentally friendly technologies, pollution control, renewable energy use, and recycling programs. |
|
2 |
Sustainability Investment |
28.1 % |
Focus on investments in green technologies, consideration of positive environmental impacts in projects, and integration of climate change factors into decision-making. |
|
3 |
Renewable Energy |
22.7 % |
Focus on energy and water conservation, efficient transportation fleet use, energy consumption reduction efforts, and climate change adaptation research. |
Source: primary data analysed, 2024
Exploratory Factor Analysis (EFA) was performed utilizing Principal Component Analysis (PCA) with Varimax rotation to uncover the underlying structure of the data. The Kaiser-Meyer-Olkin (KMO) measure indicated adequate sampling adequacy (KMO > 0.7), and Bartlett’s Test of Sphericity was statistically significant (p < 0.05), confirming that the dataset was appropriate for factor analysis. Based on the eigenvalue criterion (eigenvalues > 1), three factors were extracted. The first factor, Conservation Project, accounted for 35.2 % of the total variance and comprised indicators related to environmental conservation initiatives and community welfare enhancement projects. The second factor, Sustainability Investment, explained 28.1 % of the variance, highlighting the company’s investment in environmentally friendly technologies and the incorporation of climate change considerations into strategic decision-making processes. The third factor, Renewable Energy, accounted for 22.7 % of the variance and emphasized energy efficiency practices and the adoption of adaptation strategies to address climate change. Collectively, these three factors form a comprehensive framework for understanding the strategic dimensions underpinning the implementation of sustainable business practices.
These results are consistent with the study by Arifin and Syahruddin (2011), which showed that Indonesia has significant potential to boost its economic growth through the optimization of renewable energy and the reduction of fossil fuel usage. Support for this energy transition is also reflected in national policies such as the Low Carbon Development Initiative (LCDI), which is projected to promote economic growth while massively creating green jobs (Brodjonegoro et al., 2019).
From a regulatory perspective, although the Financial Services Authority (OJK) has not yet established a specific measurement framework for green finance, initiatives such as SEOJK No. 37/SEOJK.04/2019 and POJK 60/2017 have encouraged the application of sustainable finance principles, particularly within the banking sector and non-bank financial industries. These initiatives support the integration of conservation, sustainable investment, and energy efficiency aspects into financial decision-making.
When compared to developments in other countries, China and Germany offer interesting insights. In China, green finance has been strategically integrated into the national agenda, where it significantly influences regional energy consumption structures by shifting investments toward renewable energy and energy efficiency improvements (Sun & Chen, 2022). The government’s strong regulatory frameworks and financial incentives have been pivotal in accelerating the green transition, although challenges remain regarding regional disparities in green finance implementation (Zhao et al., 2022).
Meanwhile, in Germany, green finance has evolved in close synergy with technological innovation, driving the country’s energy transition (Energiewende) (Muhammad & Hoffmann, 2024). German financial institutions increasingly link investment decisions to the adoption of advanced renewable energy technologies and innovations in energy efficiency. The regulatory environment in Germany is more mature, supported by EU-wide taxonomy and green finance standards, making the country a leading example of connecting green investment with measurable environmental impact.
Overall, these three factors demonstrate that companies integrating environmental conservation principles, sustainable investment strategies, and renewable energy usage have the potential to make a significant contribution to Indonesia’s low-carbon economic development. Learning from the structured green finance approaches in China and Germany, Indonesia can enhance its policy frameworks, strengthen financial incentives, and build a more robust measurement system to accelerate its transition toward a green economy.
5. CONCLUSION
This study identified three key factors through Exploratory Factor Analysis (EFA), each closely aligned with the theoretical framework of sustainability. The first factor, Conservation Project, reflects the company’s focus on environmental preservation and social welfare, supporting national initiatives such as the Low Carbon Development Initiative (LCDI) and the transition toward a low-carbon economy. The second factor, Sustainability Investment, demonstrates the company’s commitment to incorporating climate change risks into long-term investment strategies, aligning with the principles of sustainable finance outlined in Indonesia’s POJK 60/2017 regulation. The third factor, Renewable Energy, highlights the company’s efforts to reduce energy consumption and transition to clean energy sources, contributing to the national renewable energy targets set for 2025. The integration of these three factors illustrates the tangible contribution of companies in promoting sustainable economic growth and improving societal welfare. Therefore, the findings of this study reinforce the importance of embedding sustainability principles as a core component of corporate business strategies in Indonesia.
5.1. Theoretical contributions
This research offers a significant theoretical contribution to green finance literature by enhancing our understanding of its multidimensional aspects through the application of Exploratory Factor Analysis (EFA). By identifying the latent factors that underpin green finance, this study not only broadens the foundational concept of green finance within the context of sustainability but also develops a comprehensive measurement framework to evaluate the environmental, social, and economic impacts of sustainable investments. The integration of financial aspects into sustainability theory and the advancement of factor theory in green finance analysis add depth to the literature while also providing a basis for the development of more effective green investment policies and practices.
5.2. Practical contributions
This research offers significant advantages for investors, businesses, and policymakers by enabling them to make more informed decisions that consider factors beyond traditional financial metrics. In this context, conventional financial metrics often focus solely on aspects such as profitability, liquidity, and operational efficiency, which may not fully reflect the long-term impacts of an investment on environmental and social sustainability. By broadening the decision-making framework to include sustainability indicators, such as carbon emission reductions, resource conservation, and social impact, stakeholders can gain a deeper understanding of the implications of their investment choices. These measures encourage and incentivize investments that align with sustainable development goals, contributing not only to environmental targets but also creating new opportunities within the green finance market. With increasing awareness of environmental and social issues, interest in green finance initiatives is growing. Investors are now more inclined to seek financial instruments that promise not only attractive returns but also positive impacts on society and the environment. This trend opens avenues for companies to design innovative products and services and for policymakers to develop regulations that support sustainable investment. Thus, this research has the potential to act as a significant catalyst in driving the transition towards a more sustainable and environmentally friendly economy.
5.3. Limitations and recommendations for future research
The primary limitation of using Exploratory Factor Analysis (EFA) in green finance research lies in its reliance on the quality and availability of data, as well as the selection of appropriate indicators. Without sufficient data, the analysis results may fail to provide a comprehensive view of the relevant factors. Additionally, the interpretation of factors in EFA is subjective, which can affect the validity of the findings. EFA results are often not generalizable due to their contextual nature and do not provide insights into causal relationships among factors. Therefore, while useful for identifying latent structures of green finance indicators, EFA has limitations in offering a deeper understanding of potential causal dynamics.
For future research, it is recommended that researchers employ Structural Equation Modeling (SEM) to explore causal relationships among green finance factors. Expanding the range of indicators and data sources, as well as examining cross-cultural or cross-sector contexts, will enhance the relevance of the findings. Additionally, adopting longitudinal studies and incorporating qualitative methods, such as interviews or case studies, can provide a more holistic and in-depth perspective. These approaches are expected to address EFA’s limitations and enrich the understanding of the dimensions of green finance in supporting sustainability.
REFERENCES
, , & (2016). The Composite Risk-Sharing Finance Index: Implications for Islamic Finance. Review of Financial Economics, 31, 18–25.
, , & (2022). Green finance and sustainable development in Europe. Economic Research-Ekonomska Istraživanja. Retrieved from https://hrcak.srce.hr/file/436622
, & (2011). Causality relationship between renewable and non-renewable energy consumption and GDP in Indonesia. Economics and Finance in Indonesia, 59(1), 1–18.
, & (2022). Evolution of green finance and its enablers: A bibliometric analysis. Renewable and Sustainable Energy Reviews, 162, 112422. https://www.sciencedirect.com/science/article/pii/S1364032122003136
Bloomberg. (2017). Bloomberg Barclays MSCI Global Green Bond.
, et al. (2019). Person in charge LCDI commissioners authors and editors system dynamics modelling team supporting modelling team analysis (IIASA): Supporting team.
, , , & (2021). Green finance as a modern tool for social and environmental security. IOP Conference Series: Earth and Environmental Science, 915, 012017. https://doi.org/10.1088/1755-1315/915/1/012017
, & (2019). Assessing the opportunities and challenges of green finance in Italy: An analysis of the biomass production sector. Sustainability, 11(2), 517. https://doi.org/10.3390/su11020517
. (2005). Aplikasi Analisis Multivariate dengan SPSS. Semarang: Badan Penerbit UNDIP.
, (2012). Mapping of green finance delivered by IDFC members in 2011. Ecofys. https://www.idfc.org/wp
, , , & (2018). The validation of Granger causality through formulation and use of finance-growth-energy indexes. Renewable and Sustainable Energy Reviews, 81(2), 1859–1867.
, , , , & (2006). Multivariate data analysis. Upper Saddle River, NJ: Pearson.
, , & (2012). Predictability, equitability, and adequacy of post-2012 international climate financing proposals. Environmental Science & Policy, 14(6), 615–626.
, , , & (2019). Climate financing needs in the land sector under the Paris Agreement: An assessment of developing country perspectives. Land Use Policy, 83, 256–269. https://doi.org/10.1016/j.landusepol.2019.02.007
, , & (2018). Construction and thinking of green finance development index. Gansu Finance, 9, 31–35.
(2013). Definition of green finance. German Development Institute / Deutsches Institut für Entwicklungspolitik (DIE). https://papers.ssrn.com/sol3/papers.cfm?abstract_id=2446496
, , , , & (2023). Nexus between green financing, renewable energy generation, and energy efficiency: Empirical insights through DEA technique. Environmental Science and Pollution Research, 30, 45157–45170. https://doi.org/10.1007/s11356-021-17092-3
, , , & (1999). Sample size in factor analysis. Psychological Methods, 4(1), 84–99. https://doi.org/10.1037/1082-989X.4.1.84
, , , , , & (2020). Developing low carbon finance index: Evidence from developed and developing economies. Finance Research Letters, Article 101520.
, & (2024). From investment to impact: The role of green finance and technological innovation on German energy transition. Renewable Energy, 226, 1205–1215. https://www.sciencedirect.com/science/article/pii/S0960148124017336
. (2021). Factor analysis as a tool for survey analysis. American Journal of Applied Mathematics and Statistics, 9(1), 4–11. https://doi.org/10.12691/ajams-9-1-2
(2022). Green finance research around the world: A review of literature. International Journal of Green Economics, 16(2), 109–130. https://doi.org/10.1504/IJGE.2022.125554
Otoritas Jasa Keuangan. (2022, 20 Januari). Taksonomi Hijau Indonesia Edisi 1.0. OJK. Diakses dari Otoritas Jasa Keuangan website
PBoC. (2016). Guidelines for establishing the green financial system. Retrieved from PBoC: http://www.pbc.gov.cn/goutongjiaoliu/113456/113469/3131687/index.html
, , , & (2024). Building Sustainability Bridges: Analyzing the relationship between risk-taking and the effectiveness of green finance in companies listed on the IDX. International Journal of Sustainable Development & Planning, 19(12). https://doi.org/10.18280/ijsdp.191226
Pricewaterhouse Coopers Consultants (PWC) (2013): Exploring Green Finance Incentives in China, PWC
(1975). Fundamental research statistics for the behavioural sciences (2nd ed.). New York: Holt Rinehart & Winston.
, & . (2018). Green financing, interrupted: Potential directions for sustainable finance in Luxembourg. Local Environment, 23(7), 717–733. https://doi.org/10.1080/13549839.2018.1428792
dan . (2010). Research Method For Business: A Skill Building Approach. Ed. 5. John Wiley @ Sons, New York
, & (2022). The impact of green finance on China’s regional energy consumption structure based on system GMM. Resources Policy, 76, 102603. https://www.sciencedirect.com/science/article/pii/S0301420722000393
, & (2013). Using multivariate statistics (6th ed.). Pearson.
(2004). Exploratory and confirmatory factor analysis: Understanding concepts and application. American Psychological Association, Washington D.C.
, , , & (2022). Does green finance inspire sustainable development? Evidence from a global perspective. Economic Analysis and Policy, 74, 889–902. https://www.sciencedirect.com/science/article/pii/S0313592622000881
, & (2022). Research on the impact of green finance on energy efficiency in different regions of China based on the DEA-Tobit model. Resources Policy, 78, 102931. https://www.sciencedirect.com/science/article/pii/S030142072200143X
, , , , & (2022). Does green finance improve energy efficiency? New evidence from developing and developed economies. Economic Change and Restructuring, 55, 237–263. https://doi.org/10.1007/s10644-021-09355-3
, & (2013). South-originating green finance: Exploring the potential. Geneva: UNEP Finance Initiative (UNEP FI), Swiss Agency for Development and Cooperation (SDC), dan International Institute for Sustainable Development (IISD). https://www.iisd.org/system/files/publications/south-originated_green_finance_en
, , , & (2022). Impact of green finance and environmental regulations on the green innovation efficiency in China. Sustainability, 14(6), 3206. https://www.mdpi.com/2071-1050/14/6/3206
(2014). Measurement analysis of China’s green finance development. China Yanan Cadre College, 6, 112–121.