Previsión de la inflación mediante inteligencia artificial: un análisis comparativo
Forecasting inflation with Artificial Intelligence: A Comparative Analysis
Daniela Agostina Gonzalez
Universidad Nacional de Córdoba (Argentina)
https://orcid.org/0009-0008-6553-3998
RESUMEN
La dinámica inflacionaria implica la necesidad de metodologías avanzadas para mejorar la precisión de su predicción. Este artículo explora el potencial de la Inteligencia Artificial (IA) para generar pronósticos de inflación a corto plazo para Argentina durante el período 2023-2024. Específicamente, se utiliza el modelo GPT-4o Mini de OpenAI, un Gran Modelo de Lenguaje (LLM), para producir predicciones condicionales, suministrando datos históricos del Índice de Precios al Consumidor (IPC) y restringiendo explícitamente su base de conocimiento a la fecha del pronóstico. Estas predicciones basadas en IA se comparan rigurosamente con la encuesta de expectativas de inflación que realiza el Banco Central de la República Argentina, conocida como Relevamiento de Expectativas de Mercado (REM). Si bien la predicción de picos de alta inflación sigue siendo un desafío para ambos enfoques, los resultados indican un rendimiento comparable entre el modelo de IA y el REM para tasas de inflación mensual de nivel medio a bajo. Por ejemplo, para los pronósticos realizados en un mes dado t (como en agosto de 2024) y evaluados a lo largo de los siete horizontes de pronóstico subsiguientes, cuando la inflación mensual es alrededor del 4%, el Error Cuadrático Medio (MSE) para las predicciones medianas del GPT-4o Mini fue de 0,90 y el Error Absoluto Medio (MAE) de 0,85, cifras muy similares a las del REM, que registró un MSE de 0,68 y un MAE de 0,73.
PALABRAS CLAVE
Grandes Modelos de Lenguaje; GPT; Predicción de inflación; Expectativas de inflación; Procesamiento del Lenguaje Natural.
ABSTRACT
Inflationary dynamics underscore the need for advanced methodologies to enhance forecasting accuracy. This paper explores the potential of Artificial Intelligence (AI) in generating short-term inflation forecasts for Argentina during the 2023-2024 period. The methodology leverages OpenAI’s GPT-4o Mini model, a Large Language Model (LLM), to produce conditional predictions by supplying historical Consumer Price Index (CPI) data and explicitly restricting its knowledge base to the forecast date. Additionally, forecasts are benchmarked against the inflation expectations survey conducted by Argentina’s Central Bank, known as the Relevamiento de Expectativas de Mercado (REM). While predicting high inflation spikes remains challenging for both approaches, our results indicate that the AI model achieves comparable performance to REM for medium to low monthly inflation rates. For instance, for forecasts made at a given month t (e.g., August 2024) and evaluated across the subsequent seven forecast horizons when monthly inflation is around 4%, the Mean Squared Error (MSE) for GPT-4o Mini’s median predictions was 0.90 and the Mean Absolute Error (MAE) was 0.85, closely aligning with REM’s performance, which recorded an MSE of 0.68 and an MAE of 0.73.
KEYWORDS
Large Language Models; GPT;4o;Mini; Inflation Forecasting in Argentina; Inflation Expectations; Survey;based Forecasts; Economic Forecasting.
Clasificación JEL: E31, E37, C53, C55.
MSC2010: 91B84, 62M20, 68T05.
1. INTRODUCCIÓN
The important task of inflation prediction is a well-established problem within the academic literature. Numerous studies have dedicated themselves to addressing this issue, focusing on various methodologies for forecasting inflation, as demonstrated by Faust and Wright (2013), who review several approaches, and by other researchers who compare the performance of different methodologies (D’Agostino and Surico, 2012; Lee, 2012; Ang et al., 2007). Given that monetary policy heavily relies on managing inflation expectations, improving forecasting techniques is critical for policymakers and academics alike. Accurate inflation predictions can provide valuable signaling and guidance to public and private institutions, policymakers, and individuals, facilitating informed decision-making and contributing to the overall stability of the economy.
Advances in cutting-edge Artificial Intelligence (AI) technologies, particularly in the development of Large Language Models (LLMs), offer novel approaches to this established economic challenge. LLMs are a class of AI models trained on extensive text corpora, primarily designed to process and generate language. Models such as OpenAI’s GPT-4 (OpenAI, 2023b), GPT-4o (OpenAI, 2024), and Google AI’s Gemini (Google AI, 2024) extend these capabilities to image creation and processing, audio analysis, and complex reasoning.
This article evaluates the capabilities of an LLM in generating short-term inflation forecasts for Argentina. Specifically, we utilize the API of OpenAI’s GPT-4o Mini model to obtain monthly forecasts for the period spanning January 2023 to February 2025. These predictions are then compared against inflation expectations provided by the Relevamiento de Expectativas de Mercado (REM) survey, conducted by Argentina’s Central Bank, using graphical tools and validation metrics.
The article is structured as follows: Section 2 provides related literature on survey expectations and LLMs, including their economic applications. Section 3 outlines the materials and methods used to conduct and compare the forecasts, while Section 4 presents the results and discussion. Finally, Section 5 concludes.
2. RELATED LITERATURE
2.1. Survey expectations: REM
The market expectations survey conducted by Argentina’s Central Bank, Relevamiento de Expectativas de Mercado (REM) (BCRA, 2024), takes forecasts from experts who try to anticipate the official data provided by the National Institute of Statistics and Census (INDEC) and the same central bank. The publication contains summary statistics, such as mean, median, standard deviation, quartiles, percentiles, and the number of survey participants. The forecasts can result from expertise or any econometric model and serve as a benchmark for short to medium-horizon forecasts. The predicted variables include inflation, interest rates, PIB growth, nominal exchange rate, unemployment, fiscal deficit, exports, and imports. In the context of inflation forecasting, these predictions are made at the end of each month, covering a month and the subsequent six months.
2.2. Large Language Models
Natural Language Processing (NLP) focuses on developing models and algorithms that enable computers to process and understand human language. NLP encompasses tasks such as text processing, summarizing, generation, translation, and more. Advances in computational capabilities have allowed the use of a larger corpus for training and enabling a higher model complexity (in terms of parameters). Earlier NLP tasks have been tackled through word embedding, where neural networks learned vector representations of words, as demonstrated in Mikolov et al. (2013). Progress in Transformer architectures has developed larger, more parallelized models, such as the bidirectional BERT (Devlin et al., 2019) and GPT-2 (Radford et al., 2019). These models are pre-trained on vast unlabeled datasets and can be fine-tuned, meaning they are adapted to specific tasks using smaller, task-oriented datasets to enhance their performance.
The term Large Language Models (LLMs) distinguishes these models from smaller-scale models, particularly in their size and the scale of pre-training datasets, for example, OpenAI’s GPT-4 and GPT-4o (OpenAI, 2023b; OpenAI, 2023b). LLMs mark a springboard advancement, transitioning from simple language modeling to solving complex tasks through prompt completion. This process involves generating text continuations based on an input prompt by leveraging learned patterns from extensive training data. Beyond text generation, LLMs exhibit emergent abilities, which are capabilities that arise from model scaling and are not present in smaller models (Wei et al., 2022). LLMs have become state-of-the-art tools across numerous research fields, taking part in public and private sectors, and individuals’ everyday life, representing cutting-edge technological advancements. A comprehensive survey on this subject is available in Zhao et al. (2023).
GPT-4o Mini model is described by OpenAI as a ‘cost-efficient small-model’, aimed at making the use of the artificial intelligence API more affordable. Trained up to October 2023, it has demonstrated competencies across a large corpus in multimodal reasoning, mathematics, coding, and fast performance. The model supports text, image, video, and audio input. It has replaced its predecessor, GPT-3.5 (OpenAI, 2023a), across all instances of ChatGPT. GPT-4o has demonstrated substantial capabilities in reasoning and few-shot learning tasks (Shahriar et al., 2024). Besides these advantages, the scope of the article’s task, involving over a million tokens, has justified the use of the GPT-4o Mini model because of its availability and lower cost. Alternatively, the methodology has been trialed with Gemini 1.5 Flash, which has a free quota with some limitations (2024), yielding no measurable results.
2.3. Artificial Intelligence applications in economics
In regard to LLMs applications in economics, the study conducted by Faria e Castro and Leibovici (2024) utilizes prompts directed at PALM’s API to forecast inflation every quarter, comparing these predictions with those derived from the Survey of Professional Forecasters (SPF). In another investigation, Bybee (2023) fine-tune the GPT-3.5 model using data from the Wall Street corpus to analyze macroeconomic expectations. Their findings reveal an under-reaction of LLMs’ expectations, despite showing the model’s potential for comprehending non-rational expectations. Additionally, Horton et al. (2024) simulate the concept of homo-economicus to examine economic behavior in the presence of information, demonstrating the capabilities of LLMs to conduct pilot studies before formal experimental research. Finally, the work of Korinek (2023) investigates the potential of LLMs to enhance productivity in economic research.
3. MATERIALS AND METHODS
This section details the methodology employed to generate and evaluate inflation forecasts using the GPT-4o Mini model, alongside a comparative analysis with traditional survey-based expectations.
3.1. Prompting Strategy for Inflation Forecasting
Prompting a large language model (LLM) involves providing the model with specific instructions, known as an input or prompt, and asking for the model’s response, or completion, to the designated task, named as output. The effectiveness of this process is based on delivering clear and specific orders, along with giving the model ‘time to think’, which encompasses the steps taken before completing the task. Additional tools for enhancing output quality include the use of delimiters, specifying desired output formats, providing examples of the anticipated results (often referred to as few-shot prompting), and implementing validation of conditions before presenting the final answer. The prompting strategy in this article adheres to the interaction flow outlined by Gao et al. (2024) and encompasses planning, facilitating, iterating, and testing phases. This structured approach is crucial for adapting a general-purpose LLM to a specialized quantitative forecasting task.
Inflation forecasts for Argentina are obtained by prompting the GPT-4o Mini model and matching the structure of REM’s inflation expectations publication. The objective is to forecast inflation for the current month (horizon ) and the subsequent six months (), represented as where is the forecasting month from January 2023 to August 2024. This design choice allows for a direct comparison with the REM survey, which also provides forecasts for similar short- to medium-term horizons.
The workflow involves careful planning of the prompt to request predictions for each month. The facilitating includes supplying crucial context information, specifying the country (Argentina), and presenting the historical Consumer Price Index (CPI) data from the preceding six months ( to ). The choice of six lagged months of CPI data is motivated by common practices in econometric inflation forecasting models (e.g., simple autoregressive models) that often utilize recent past inflation as a key predictor. While longer lags or seasonal components could be explored, this initial selection is motivated by a concise and directly relevant historical window for the LLM.
The iterating phase allows for successive adjustments by modifying the inputs and specifying the desired output format. Finally, the output underwent testing and evaluation until a satisfactory prompt has been identified. This instruction is repeated times for each , corresponding to the number of participants in the REM’s survey, for example, (e.g., in January 2023). This repetition is chosen to simulate a similar “panel” of expert forecasts, allowing for the calculation of mean and median LLM predictions and their associated variability, directly mirroring the summary statistics provided by REM.
The final prompt designed for conditional forecasting based on historical context is:
Assume you are in Argentina on t-date. Also, you know that the monthly inflation for the last 6 months was: ; ; ; ; ; . Please make your best forecast of monthly inflation based on the Consumer Price Index (CPI) – General Level Argentina, for the period to . To give your answer, do not use information available in your training data after . Give your answer in numbers, monthly percentages. Provide them in python dictionary format with the key being the month and the value the corresponding percentage. Limit your answer to the dictionary and do not include additional information.
The variable ‘t-date’ refers to the end-of-month date of the month when REM’s survey is conducted. For instance, for January 2023, the t-date is ‘January 31, 2023’ and the forecasted months extend from January 2023 () to July 2023 (). The information denoted as for represents the monthly inflation rates published by INDEC, based on Price Consumer Index (PCI) data. The resulting forecast is labeled as conditional due to the supplied historical context. In contrast, if past inflation information or time period restrictions are not imposed, the forecast would be considered unconditional.
A crucial aspect for reproducibility and controlling the model’s output is the temperature parameter, which governs the randomness of the generated responses. It ranges from 0 (deterministic) to 2 (highly random). For the main analysis, temperature was set to 1.0. This intermediate value was chosen to allow for some variability in responses, simulating a range of expert opinions similar to a survey, without becoming overly chaotic. Robustness checks with temperature settings of 0.5 and 1.5 are presented in Appendix B, demonstrating how different levels of stochasticity impact forecast accuracy and variability.
3.2. Prompting examples for forecasting
A prompt example is presented to clarify the methodology process.
Assume you are in Argentina on January 31, 2023. Also, you know that the monthly inflation for the last 6 months was: July 2022: 7.4%, August 2022: 7%, September 2022: 6.2%, October 2022: 6.3%, November 2022: 4.9%, December 2022: 5.1%. Please make your best forecast of monthly inflation based on the Consumer Price Index (CPI) – General Level Argentina, for the period January 2023 to July 2023. To give your answer, do not use information available in your training data after January 2023. Give your answer in numbers, monthly percentages. Provide them in python dictionary format with the key being the month and the value the corresponding percentage. Limit your answer to the dictionary and do not include additional information.
The output is:
« Python
{
“January 2023”: 5.0,
“February 2023”: 5.0,
“March 2023”: 5.5,
“April 2023”: 5.5,
“May 2023”: 6.0,
“June 2023”: 6.0,
“July 2023”: 6.5
}
»
This process of querying the API is repeated m times, where m represents the number of participants in the REM survey for that specific month. The resulting Python list of dictionaries allows for a transformation into a dataframe with rows and 7 columns, representing the forecasts from to (January 2023 to July 2023, for example). For replicability, code, raw input data, and generated forecast outputs are available in a GitHub repository 1.
3.3. Assessing forecasts and Limitations
For the purpose of computing accuracy metrics and comparing the forecasts with the REM benchmark, mean and median values from the resulting samples of LLM predictions are used. To assess predictive performance comprehensively, several widely accepted validation metrics are computed: Mean Squared Error (MSE), Root Mean Squared Error (RMSE), Mean Absolute Error (MAE), and Mean Bias Error (MBE), which assesses directional accuracy. Additionally, the Hit Rate (HR) is considered to determine the percentage of correctly predicted inflation direction (increase vs. decrease). These metrics are standard in the forecasting literature, facilitating comparability with the REM survey and providing a richer understanding of forecast quality.
Mean Squared Error (MSE): MSE is particularly valuable because it penalizes larger deviations more heavily, thereby highlighting the impact of extreme forecast errors.
Where represents the forecast made at time , denotes the forecast horizon, ranging from to , and is the inflation rate obtained from official sources. The variable refers to the number of forecasted periods, encompassing the current month and six months ahead.
Root Mean Squared Error (RMSE): RMSE is the square root of the MSE and is often preferred as it is expressed in the same units as the forecast variable, making it more interpretable than MSE. It also retains the property of penalizing larger errors more heavily.
Mean Absolute Error (MAE): MAE provides a direct and intuitive measure of the average prediction error, offering a clear sense of overall accuracy.
.
Where corresponds to the absolute value. In short, metrics at time account for all forecasts made in (from to ). For example, the MSE of January 2023 averages the squared distances of forecasts for January 2023 to July 2023, each one with the corresponding official inflation data.
Mean Bias Error (MBE): MBE measures the average directional error, indicating systematic over- or under-prediction. A positive MBE suggests a tendency to overpredict, while a negative MBE indicates underprediction.
.
Hit Rate (HR): HR assesses the model’s ability to correctly predict the direction of change in inflation. It is calculated as the percentage of times the forecast correctly predicts an increase or decrease in inflation compared to the previous period. That is, the quotient between the number of correct directional predictions from month to and .
While forecasts are generated at a fixed point in time (up to August 2024), they have not been modified or updated thereafter. However, the evaluation of their accuracy has been conducted at the time of writing (June 2025), once actual inflation data has become available for part of the forecast horizon. For example, the forecast made at spans from August 2024 to February 2025, and the validation metrics are computed using the corresponding official inflation data. This procedure ensures that all forecasts remain fixed as originally generated, while their accuracy is assessed using the most recent data available at the time of evaluation.
To formally assess whether the observed differences in predictive performance between the models are statistically significant, two approaches are presented:
Diebold-Mariano (DM) test: The DM test (Diebold & Mariano, 1995) compares two forecast error series based on a defined loss function. This study uses the squared error loss function (), which aligns with the Mean Squared Error (MSE) metric. The DM test is performed across all common forecast horizons ( to ) by comparing GPT-4o Mini vs. REM forecasts. The null hypothesis () is that the two models have equal predictive accuracy. If the hypothesis is rejected, the sign of DM statistic indicates which model is superior.
Theil’s U Statistic: To provide essential context regarding the economic value added by the GPT-4o Mini forecast, we compare its performance against a non-structural Naive (Random Walk) benchmark model. The Naive forecast for all horizons is defined as the actual inflation rate from the preceding month (). This comparison is quantified using Theil’s U statistic or Theil’s Inequality Coefficient (Theil, 1967), which measures the ratio of the Root Mean Squared Error (RMSE) of the model’s forecasts to the RMSE of the Naive model’s forecasts:
.
A value indicates that the model (GPT-4o Mini) outperforms the Naive benchmark, suggesting that the LLM approach adds genuine forecasting value. A value suggests that the model is no better or is worse than simply using the last known inflation rate.
Lastly, it is crucial to acknowledge the limitations when using LLMs for economic forecasting. While the prompt explicitly attempts to restrict the model from using post-t information from its training data, fully preventing data leakage from the LLM’s pre-training corpus is challenging. This means the model might implicitly draw on information beyond the specified cut-off date, potentially impacting the purity of the “conditional” forecast. Furthermore, the stochastic nature of LLM outputs, even with controlled temperature settings, introduces a degree of irreproducibility in exact token sequences, although the aggregated statistical properties (mean/median) are more stable. Finally, the interpretability of how the LLM arrives at its numerical predictions remains a black box, a common challenge with complex AI models, making it difficult to trace back the underlying “economic reasoning” compared to traditional econometric models. These limitations underscore the need for careful validation and contextual interpretation of the forecasts.
4. RESULTS AND DISCUSSION
4.1. GPT-4o-Mini forecasts
Tables 1 and 2 present the validation metrics for GPT-4o Mini’s mean and median forecasts, respectively, aggregated across the seven forecast horizons ( to ) for each base month. Notably, the performance improved in both early and later parts of the forecast period, a pattern also observed in REM forecasts for both mean and median estimates (see Appendix A). For example, GPT-4o Mini’s median prediction Mean Squared Error (MSE) was 0.90, and the Mean Absolute Error (MAE) was 0.85 in August 2024, while REM’s metrics recorded an MSE of 0.68 and an MAE of 0.73. The MBE indicated that, on average, the predictions were lower than the actual inflation for the first year of the prediction sets. The results also revealed an inverse relationship between its Hit Rate (HR) and its MSE/MAE. During the period of high volatility and acceleration (April to December 2023), the model demonstrated a high directional accuracy, with the Hit Rate ranging from 57% to 85%. This suggested the LLM effectively captured the strong momentum signal indicated by the rising historical CPI data. However, this period also corresponded to the highest MSE values, due to the model’s systematic underestimation of extreme inflation spikes (e.g., the December 2023 event). In essence, the GPT-4o Mini correctly predicted that inflation would increase, but it failed to capture the magnitude of the tail risk. Conversely, in the more stable or disinflationary environment following the peak (post-December 2023), the Hit Rate dropped significantly to around 43%. This low directional accuracy reflected the model’s difficulty in precisely predicting small changes or inflection. However, this period was characterized by a significantly lower MSE/MAE. As the true inflation rate became more moderate and stable, the model’s forecast error diminished, resulting in better performance despite the loss of directional consistency.
Table 1: Metrics for GPT-4o Mini Mean forecasts.
|
Month |
MSE |
RMSE |
MAE |
MBE |
Hit Rate |
|---|---|---|---|---|---|
|
01/2023 |
3,28 |
1,81 |
1,56 |
–1,56 |
42,86 |
|
02/2023 |
7,48 |
2,73 |
1,88 |
–1,88 |
57,14 |
|
03/2023 |
12,81 |
3,58 |
2,55 |
–2,47 |
42,86 |
|
04/2023 |
7,64 |
2,76 |
2,06 |
–1,13 |
71,43 |
|
05/2023 |
7,03 |
2,65 |
2,54 |
0,21 |
57,14 |
|
06/2023 |
51,36 |
7,17 |
4,80 |
–3,88 |
71,43 |
|
07/2023 |
86,42 |
9,30 |
7,09 |
–7,09 |
57,14 |
|
08/2023 |
98,95 |
9,95 |
8,40 |
–8,40 |
57,14 |
|
09/2023 |
70,76 |
8,41 |
6,43 |
–5,83 |
71,43 |
|
10/2023 |
46,04 |
6,79 |
4,77 |
–3,42 |
85,71 |
|
11/2023 |
77,77 |
8,82 |
6,94 |
–6,12 |
71,43 |
|
12/2023 |
47,09 |
6,86 |
5,21 |
–2,80 |
85,71 |
|
01/2024 |
32,64 |
5,71 |
5,55 |
5,55 |
42,86 |
|
02/2024 |
40,11 |
6,33 |
6,24 |
6,24 |
42,86 |
|
03/2024 |
31,29 |
5,59 |
5,21 |
5,21 |
42,86 |
|
04/2024 |
21,38 |
4,62 |
4,45 |
4,45 |
42,86 |
|
05/2024 |
10,52 |
3,24 |
3,21 |
3,21 |
42,86 |
|
06/2024 |
0,69 |
0,83 |
0,68 |
–0,66 |
71,43 |
|
07/2024 |
0,55 |
0,74 |
0,65 |
0,61 |
57,14 |
|
08/2024 |
1,10 |
1,05 |
0,94 |
0,83 |
42,86 |
Table 2: Metrics for GPT-4o Mini Median forecasts.
|
Month |
MSE |
RMSE |
MAE |
MBE |
Hit Rate |
|---|---|---|---|---|---|
|
01/2023 |
3,56 |
1,89 |
1,61 |
–1,61 |
42,86 |
|
02/2023 |
7,25 |
2,69 |
1,87 |
–1,87 |
42,86 |
|
03/2023 |
13,10 |
3,62 |
2,56 |
–2,47 |
42,86 |
|
04/2023 |
7,80 |
2,79 |
2,12 |
–1,16 |
57,14 |
|
05/2023 |
6,81 |
2,61 |
2,50 |
0,39 |
57,14 |
|
06/2023 |
50,44 |
7,10 |
4,76 |
–3,84 |
71,43 |
|
07/2023 |
87,60 |
9,36 |
7,10 |
–7,04 |
57,14 |
|
08/2023 |
98,91 |
9,95 |
8,41 |
–8,41 |
57,14 |
|
09/2023 |
72,51 |
8,52 |
6,50 |
–5,87 |
71,43 |
|
10/2023 |
45,03 |
6,71 |
4,71 |
–3,31 |
85,71 |
|
11/2023 |
80,20 |
8,96 |
7,10 |
–6,44 |
85,71 |
|
12/2023 |
45,30 |
6,73 |
5,19 |
–2,99 |
85,71 |
|
01/2024 |
17,18 |
4,14 |
3,94 |
3,94 |
42,86 |
|
02/2024 |
32,87 |
5,73 |
5,64 |
5,64 |
42,86 |
|
03/2024 |
23,98 |
4,90 |
4,46 |
4,46 |
57,14 |
|
04/2024 |
21,29 |
4,61 |
4,46 |
4,46 |
42,86 |
|
05/2024 |
9,13 |
3,02 |
2,99 |
2,99 |
42,86 |
|
06/2024 |
0,62 |
0,79 |
0,67 |
–0,64 |
57,14 |
|
07/2024 |
0,35 |
0,59 |
0,54 |
0,49 |
42,86 |
|
08/2024 |
0,90 |
0,95 |
0,85 |
0,74 |
42,86 |
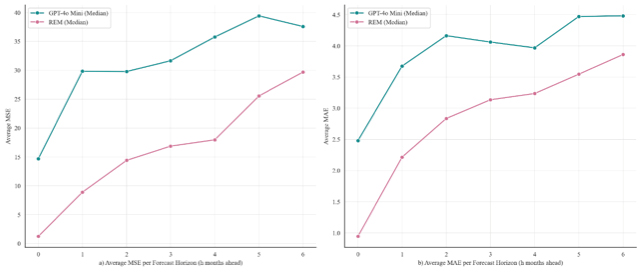
To provide a more granular understanding of performance decay with longer horizons, Figure 1 illustrates the MSE and MAE for both GPT-4o Mini (median) and REM at distinct forecast horizons (e.g.,,,, ). This analysis revealed how accuracy typically diminishes as the forecast horizon extends, allowing for a clearer comparison of the models’ capabilities over different timeframes.
Figure 1: GPT-4o Mini and REM median forecasts for different horizons.
To assess forecasting variability, both the standard deviation (SD) and interquartile range (IQR) are reported in Table 3. Each row presents the corresponding measure for month () and for the six periods ahead. As can be observed, variability increases as the forecast horizon lengthens. The Appendix provides additional results from this section, as an exercise of robustness, including validation metrics and variability measures for a lower temperature setting (0.5), which reduces randomness without making the model fully deterministic, as is the case with a temperature of zero (Appendix B1). It is worth noticing that the model with default temperature (1.0) showed more consistent performance across the full time horizon, especially in early and mid-2023, where it generally outperformed the model with low temperature (0.5) in terms of MAE and MSE. However, the low-temperature model exhibited stronger performance in later periods (particularly in 2024), with lower median errors, suggesting improved robustness in more stable inflation contexts.
Additionally, a higher temperature setting (1.5) is included in order to compare the model’s behavior (Appendix B2). Noticeably, despite having higher variability, the 1.5 temperature led to lower error metrics, demonstrating better accuracy compared to a lower temperature (0.5). The maximum temperature value (2) results in hallucinations, preventing successful looping and dictionary processing.
Table 3: Variability measures for GPT-4o Mini over horizon forecasts.
|
Month |
SD t |
SD t+1 |
SD t+2 |
SD t+3 |
SD t+4 |
SD t+5 |
SD t+6 |
IQR t |
IQR t+1 |
IQR t+2 |
IQR t+3 |
IQR t+4 |
IQR t+5 |
IQR t+6 |
|---|---|---|---|---|---|---|---|---|---|---|---|---|---|---|
|
01/2023 |
0,3 |
0,4 |
0,5 |
0,7 |
0,8 |
0,9 |
0,9 |
0,5 |
0,5 |
0,6 |
0,9 |
1,1 |
1,1 |
1,0 |
|
02/2023 |
0,3 |
0,3 |
0,4 |
0,5 |
0,5 |
0,6 |
0,6 |
0,5 |
0,5 |
0,7 |
0,5 |
0,6 |
0,6 |
0,7 |
|
03/2023 |
0,1 |
0,1 |
0,2 |
0,2 |
0,4 |
0,4 |
0,4 |
0,0 |
0,1 |
0,1 |
0,2 |
0,3 |
0,5 |
0,6 |
|
04/2023 |
0,3 |
0,5 |
0,7 |
0,7 |
0,7 |
0,8 |
0,8 |
0,5 |
0,7 |
1,0 |
1,0 |
1,1 |
1,1 |
1,2 |
|
05/2023 |
0,1 |
0,2 |
0,4 |
0,6 |
0,9 |
1,2 |
1,5 |
0,0 |
0,1 |
0,5 |
0,9 |
1,3 |
1,6 |
2,0 |
|
06/2023 |
0,3 |
0,3 |
0,4 |
0,5 |
0,6 |
0,8 |
0,9 |
0,2 |
0,4 |
0,5 |
0,5 |
0,7 |
0,9 |
1,3 |
|
07/2023 |
0,4 |
0,5 |
0,6 |
0,6 |
0,6 |
0,7 |
0,7 |
0,6 |
0,7 |
1,0 |
1,2 |
0,9 |
1,0 |
1,0 |
|
08/2023 |
0,1 |
0,2 |
0,2 |
0,4 |
0,5 |
0,5 |
0,5 |
0,1 |
0,1 |
0,2 |
0,5 |
0,7 |
0,7 |
0,7 |
|
09/2023 |
1,2 |
0,9 |
1,0 |
0,9 |
0,9 |
1,0 |
1,0 |
1,6 |
1,1 |
1,2 |
1,5 |
1,5 |
1,5 |
1,5 |
|
10/2023 |
0,5 |
0,8 |
0,9 |
1,1 |
1,1 |
1,1 |
1,1 |
0,5 |
0,5 |
0,5 |
1,5 |
1,5 |
1,5 |
1,5 |
|
11/2023 |
0,5 |
0,6 |
0,8 |
1,1 |
1,4 |
1,5 |
1,7 |
0,5 |
1,0 |
1,1 |
1,0 |
1,9 |
2,4 |
2,0 |
|
12/2023 |
1,1 |
1,1 |
1,0 |
1,0 |
1,1 |
1,1 |
1,2 |
2,0 |
2,0 |
1,0 |
1,5 |
2,5 |
1,5 |
1,5 |
|
01/2024 |
4,5 |
4,3 |
4,5 |
4,3 |
4,1 |
3,7 |
3,2 |
5,5 |
4,0 |
3,5 |
5,0 |
4,0 |
4,0 |
3,0 |
|
02/2024 |
2,1 |
1,8 |
1,9 |
2,3 |
2,5 |
2,5 |
2,5 |
2,0 |
2,5 |
3,0 |
3,3 |
3,1 |
3,3 |
3,6 |
|
03/2024 |
1,5 |
1,3 |
1,8 |
2,8 |
3,3 |
2,8 |
3,0 |
2,0 |
1,5 |
2,0 |
3,0 |
3,5 |
3,5 |
3,0 |
|
04/2024 |
0,3 |
0,5 |
0,9 |
1,0 |
1,1 |
1,2 |
1,5 |
0,5 |
0,5 |
0,8 |
0,9 |
1,0 |
1,0 |
1,6 |
|
05/2024 |
0,7 |
0,7 |
0,9 |
1,3 |
1,5 |
1,6 |
1,8 |
0,6 |
1,0 |
1,0 |
1,0 |
1,5 |
2,0 |
2,1 |
|
06/2024 |
0,2 |
0,3 |
0,3 |
0,5 |
0,5 |
0,7 |
0,8 |
0,2 |
0,4 |
0,5 |
1,0 |
1,0 |
0,9 |
1,0 |
|
07/2024 |
0,3 |
0,2 |
0,4 |
0,5 |
0,6 |
0,6 |
0,7 |
0,2 |
0,1 |
0,5 |
0,8 |
0,6 |
0,6 |
0,7 |
|
08/2024 |
0,3 |
0,4 |
0,5 |
0,6 |
0,7 |
0,7 |
0,8 |
0,5 |
0,6 |
1,0 |
1,2 |
1,1 |
1,0 |
1,1 |
4.2. AI’s forecasts and REM comparison
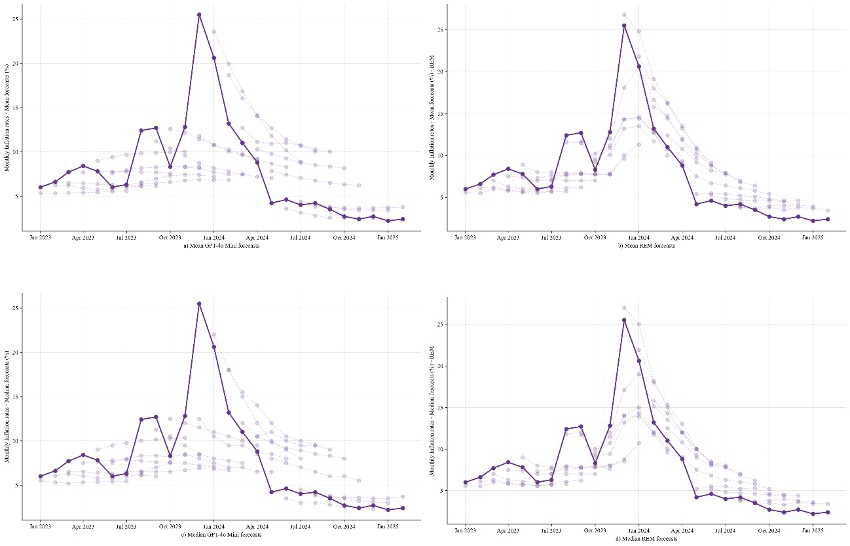
This section uses various visualizations to illustrate the performance of the two forecasting methods, GPT-4O-mini and REM. Figure 2 presents the actual PCI inflation as a solid line, with forecasted values for various horizons displayed as dotted lines, following Faria e Castro and Leibovici (2024). The upper panel illustrates the mean estimates, while the lower panel depicts the median forecasts. Both models demonstrated a similar trend from early 2023 until October, underestimating the realized inflation. Notably, the GPT-4O-mini forecast failed to capture the sharp rise in inflation in December 2023 and subsequently overestimated the following months, a pattern also observed in REM forecasts, though to a lesser extent. By April 2024, both forecasts began to converge towards the 4 percent line, indicating improved alignment with realized inflation.
Figure 2: Actual inflation and forecasts over horizons.
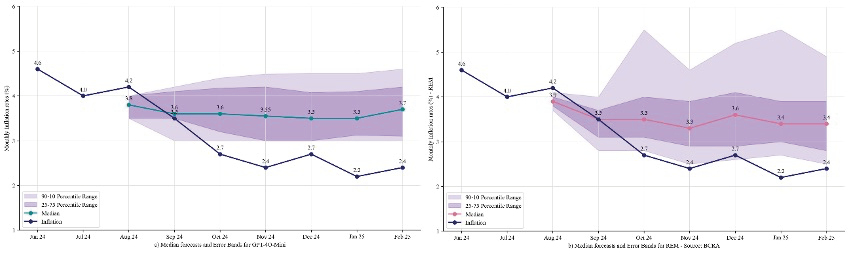
Next, Figure 3 presents a comparative analysis of median forecasts from GPT-4o-Mini and the REM survey, along with their respective percentile-based error bands, for the period spanning August 2024 to February 2025. The REM data were drawn from the official technical report published in September 2024 (BCRA, 2024). Notably, the interquartile range (IQR) in the GPT-4o Mini forecasts (Figure 2a) was narrower, indicating lower forecast dispersion and greater consistency across simulated predictions. Furthermore, the 0.1 to 0.9 percentile bands exhibited a reduced spread relative to those of the REM forecasts (Figure 2b), suggesting more constrained uncertainty in the tails of the distribution and fewer extreme forecast deviations.
Figure 3: Percentile error bands for median forecasts.
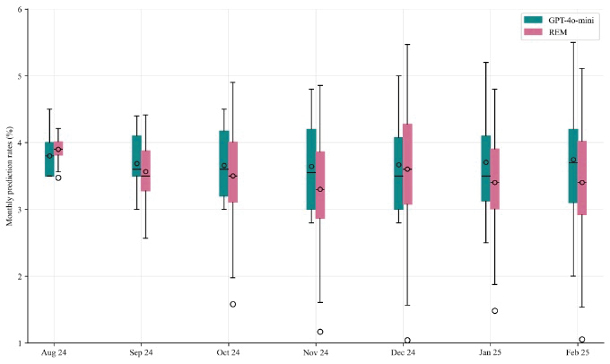
Furthermore, Figure 4 illustrates boxplots for each month, providing insights into the distribution of predictions, where REM observations are simulated. These simulations consisted of a random normal variable based on quartiles and standard deviations published in REM reports. The chart revealed similarities between the median and mean values of both forecasts, with some notable differences in the interquartile range, as reflected in the central 50% distribution box.
Figure 4: Boxplots for monthly forecasts.
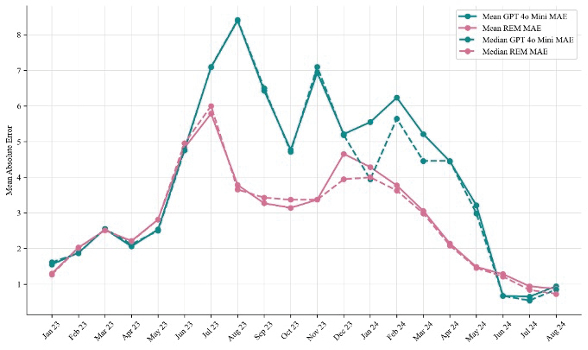
Afterwards, Figure 5 highlights the Mean Squared Error (MSE) evolution over the forecast period. Although there was a notable divergence in August 2023 and a spike in November 2024, both models exhibited comparable behavior at the start and conclusion of the forecast period. Similarly, Figure 6 depicts the Mean Absolute Error (MAE), showing noticeable periods of REM outperforming and a convergence toward the final months of the forecast horizon.
Figure 5: Mean squared errors for mean and median forecasts.
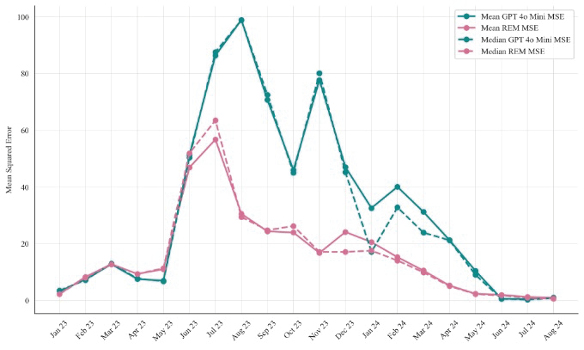
Figure 6: Mean absolute errors for Mean and Median forecasts.
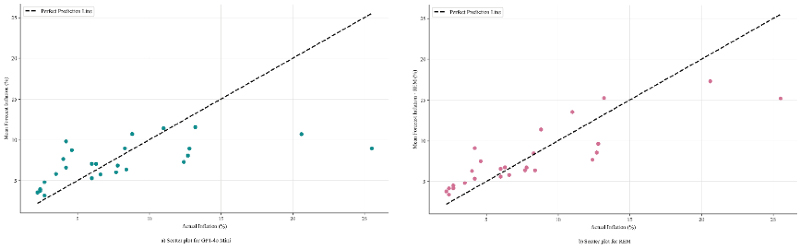
Finally, Figure 7 illustrates deviations from the perfect forecast line. As observed, similar dispersion patterns emerged for lower inflation rates in GPT-4o-Mini Mean forecasts (Panel a). This suggests that LLM models may provide valuable insights, particularly when inflation rates tend toward lower levels.
Figure 7: Dispersion over perfect forecast.
4.3. Statistical Significance and Benchmark Comparison
To formally assess whether the performance differences between the GPT-4o Mini and REM forecasts are statistically significant, the Diebold-Mariano (DM) test is presented in Table 4. The DM test was applied to the forecast errors of both models across all common forecast horizons. Results indicated that, for all horizons, there is no statistically significant difference in predictive accuracy between the GPT-4o Mini and REM forecasts at the 5% level.
Table 4: DM test for GPT-4o Mini versus REM.
|
Horizon |
DM Stat (GPT vs. REM) |
P-Value |
|---|---|---|
|
0 |
1,553 |
0,121 |
|
1 |
1,647 |
0,100 |
|
2 |
1,664 |
0,096 |
|
3 |
1,692 |
0,091 |
|
4 |
1,509 |
0,131 |
|
5 |
1,649 |
0,099 |
|
6 |
1,495 |
0,135 |
Furthermore, to contextualize the GPT-4o Mini’s performance, its accuracy was compared against a simple naive benchmark model. Specifically, a random walk forecast where (i.e., the previous month’s inflation was carried forward). This comparison, based on Theil’s U statistic, helped determine whether the LLM model added value beyond a simplistic baseline. As shown in Table 5, across all horizons, the GPT-4o Mini model consistently outperformed the naive benchmark ().
|
Horizon |
Theil U GPT vs Naive |
|---|---|
|
0 |
0,909 |
|
1 |
0,864 |
|
2 |
0,812 |
|
3 |
0,771 |
|
4 |
0,707 |
|
5 |
0,692 |
|
6 |
0,661 |
5. CONCLUSIONS
The state-of-the-art advancements in Large Language Models (LLMs) are driving various fields of research to incorporate this emerging technology into their agenda. This article presents evidence of Argentina’s inflation forecasting using GPT-4o Mini to produce short-horizon predictions, rigorously benchmarked against the REM survey and a Naive model using multiple error metrics and statistical tests.
The methodology, however, is subject to some limitations. These include the lack of control over the data used in the pre-trained model, the sensitivity of prompts, and the absence of full token-level reproducibility. While the first limitation was mitigated by providing context-specific information and restricting data usage up to a specific date, and the second was addressed through the prompt refinement workflow and temperature variations for robustness testing, the issue of strict reproducibility remains a significant challenge.
A key methodological limitation related to the conditional approach is the choice of input context. The selection of a six-month window of lagged CPI data is motivated by common practices in short-term econometric forecasting (e.g., simple autoregressive models). However, the optimal length of this forecasting window for an LLM remains an open question. Different input structures, such as a twelve-month window or a length that captures seasonal effects and the inclusion of other macroeconomic variables (like exchange rate or interest rate data), could potentially yield different predictive outcomes.
Future research could benefit from utilizing the more advanced, albeit more expensive, GPT-4o model for forecasts. Additionally, progressively incorporating inflation data from former periods through all the prompts could enhance the context information. An interesting avenue for further exploration would involve obtaining justifications for the model’s predictions as a means to assess the underlying information used to generate the forecasts. Furthermore, another direction for future work is a direct and granular conceptual comparison between the LLM approach and established time-series econometrics, such as ARIMA or Vector Autoregression (VAR) models. Such a comparison would help define where the LLM’s non-linear, text-data-driven insights complement or supersede conventional linear forecasting methods.
Overall, this article provides preliminary evidence of the potential for LLMs to conduct forecasts for various economic variables in Argentina. The use of LLMs, such as GPT-4o Mini, offers an innovative approach to forecasting, leveraging vast amounts of linguistic and contextual data that allow for flexible, adaptive models capable of capturing complex patterns in economic trends. The AI’s approach can serve as a complement to conventional econometric techniques and a valuable tool for central banks, policymakers, and financial analysts, offering novel insights. While further research is needed to improve their accuracy and interpretability, LLMs represent a promising frontier in economic forecasting and decision support systems.
AUTHOR CONTRIBUTION
The author is entirely responsible for all phases of this research and manuscript preparation. This includes conceptualization, methodology, data collection and analysis, interpretation of results, and final review and editing of the text.
FUNDING
This research did not receive any specific grant from public, commercial, or not-for-profit funding agencies.
REFERENCES
., ., & . (2007). Do macro variables, asset markets, or surveys forecast inflation better? Journal of Monetary Economics, 54(4), 1163–1212.
(2024). Relevamiento de Expectativas de Mercado (REM). August 2024 Report. BCRA.
. (2023). Surveying Generative AI’s Economic Expectations. arXiv Preprint. arXiv:2305. 02823.
., & . (2012). A century of inflation forecasts. Review of Economics and Statistics, 94(4), 1097–1106.
., ., ., y . (2019). BERT: Pre-training of deep bidirectional transformers for language understanding. En , , y (Eds.), Proceedings of the 2019 Conference of the North American Chapter of the Association for Computational Linguistics: Human Language Technologies (Vol. 1, pp. 4171–4186). Association for Computational Linguistics. https://doi.org/10.18653/v1/N19-1423
. & . (1995). Comparing predictive accuracy. Journal of Business and Economic Statistics, 13, 253-63.
., & . (2024). Artificial Intelligence and Inflation Forecasts. Federal Reserve Bank of St. Louis Working Papers 2023-015. https://doi.org/10.20955/wp.2023.015.
., & . (2013). Forecasting inflation. In & (Eds.), Handbook of economic forecasting (Vol. 2, pp. 2–56). Elsevier.
., ., ., ., ., & . (2024). A Taxonomy for Human-LLM Interaction Modes: An Initial Exploration. Extended Abstracts of the CHI Conference on Human Factors in Computing Systems, 1–11.
. (2023). Gemini: A Family of Highly Capable Multimodal Models. arXiv Preprint. https://doi.org/10.48550/arxiv.2312.11805.
. (2024). Google AI for Developers. Retrieved from https://ai.google.dev/pricing
., ., y . (2024). Large language models as simulated economic agents: What can we learn from Homo silicus? (Working Paper No. 32013). National Bureau of Economic Research. https://doi.org/10.3386/w32013.
. (2023). Language Models and Cognitive Automation for Economic Research. NBER Working Paper, 30957. https://doi.org/10.3386/w30957.
. (2012). Forecasting Inflation for Inflation-Targeted Countries: A Comparison of the Predictive Performance of Alternative Inflation Forecasting Models. The Journal of Business and Economic Studies, 18(1), 75–95.
., ., ., ., & . (2013). Distributed representations of words and phrases and their compositionality. Advances in Neural Information Processing Systems, 26.
. (2023a). GPT-3.5: Technical Overview. Retrieved 18 September 2023, from https://platform.openai.com.
. (2023b). GPT-4 Technical Report. Retrieved from https://openai.com/research/gpt-4.
. (2024). GPT-4o Technical Report. Retrieved from https://openai.com/index/hello-gpt-4o/.
., ., ., ., ., & . (2019). Language Models are Unsupervised Multitask Learners. Retrieved from https://cdn.openai.com/better-language-models/language_models_are_unsupervised_multitask_learners.pdf.
., ., ., ., ., ., ., & . (2024). Putting GPT-4o to the Sword: A Comprehensive Evaluation of Language, Vision, Speech, and Multimodal Proficiency. Applied Sciences, 14(17), 7782. https://doi.org/10.3390/app14177782.
. (1967). Economics and Information Theory. North-Holland Publishing Company, Amsterdam.
., ., ., ., ., ., ., ., ., ., ., ., ., ., ., . (2022). Emergent Abilities of Large Language Models. arXiv preprint. arXiv:2206.07682.
., ., ., ., ., ., ., ., ., ., ., ., ., ., ., ., ., ., ., ., ., . (2023). A Survey of Large Language Models. arXiv preprint. arXiv:2303.18223.
Appendix A: Mean and Median validation metrics for REM mean and median forecasts
Table A1: Validation metrics for mean forecasts: REM forecasts.
|
Date |
MSE |
RMSE |
MAE |
MBE |
Hit Rate |
|---|---|---|---|---|---|
|
01/2023 |
2,35 |
1,53 |
1,30 |
–1,30 |
42,86 |
|
02/2023 |
8,36 |
2,89 |
2,03 |
–2,03 |
42,86 |
|
03/2023 |
12,87 |
3,59 |
2,51 |
–2,51 |
57,14 |
|
04/2023 |
9,42 |
3,07 |
2,21 |
–1,70 |
71,43 |
|
05/2023 |
11,09 |
3,33 |
2,81 |
–1,44 |
42,86 |
|
06/2023 |
46,94 |
6,85 |
4,83 |
–4,09 |
57,14 |
|
07/2023 |
56,81 |
7,54 |
5,79 |
–5,59 |
57,14 |
|
08/2023 |
30,59 |
5,53 |
3,79 |
–3,53 |
85,71 |
|
09/2023 |
24,44 |
4,94 |
3,27 |
–2,93 |
85,71 |
|
10/2023 |
24,03 |
4,90 |
3,14 |
–2,46 |
100,00 |
|
11/2023 |
16,83 |
4,10 |
3,37 |
1,03 |
57,14 |
|
12/2023 |
24,21 |
4,92 |
4,66 |
4,66 |
57,14 |
|
01/2024 |
20,64 |
4,54 |
4,29 |
4,29 |
42,86 |
|
02/2024 |
15,34 |
3,92 |
3,77 |
3,77 |
42,86 |
|
03/2024 |
10,61 |
3,26 |
3,06 |
3,06 |
57,14 |
|
04/2024 |
5,33 |
2,31 |
2,14 |
2,14 |
57,14 |
|
05/2024 |
2,43 |
1,56 |
1,49 |
1,49 |
42,86 |
|
06/2024 |
2,03 |
1,43 |
1,29 |
1,29 |
42,86 |
|
07/2024 |
1,33 |
1,15 |
0,94 |
0,83 |
42,86 |
|
08/2024 |
1,00 |
1,00 |
0,87 |
0,79 |
42,86 |
Table A2: Validation metrics for median forecasts: REM forecasts.
|
Date |
MSE |
RMSE |
MAE |
MBE |
Hit Rate |
|---|---|---|---|---|---|
|
01/2023 |
2,28 |
1,51 |
1,27 |
–1,27 |
42,86 |
|
02/2023 |
8,14 |
2,85 |
2,01 |
–2,01 |
42,86 |
|
03/2023 |
12,83 |
3,58 |
2,51 |
–2,51 |
42,86 |
|
04/2023 |
9,40 |
3,07 |
2,20 |
–1,71 |
71,43 |
|
05/2023 |
11,44 |
3,38 |
2,81 |
–1,47 |
42,86 |
|
06/2023 |
51,96 |
7,21 |
4,96 |
–4,21 |
57,14 |
|
07/2023 |
63,56 |
7,97 |
6,00 |
–5,80 |
57,14 |
|
08/2023 |
29,47 |
5,43 |
3,66 |
–3,43 |
85,71 |
|
09/2023 |
24,84 |
4,98 |
3,43 |
–3,09 |
85,71 |
|
10/2023 |
26,31 |
5,13 |
3,37 |
–2,83 |
100,00 |
|
11/2023 |
17,18 |
4,14 |
3,37 |
0,29 |
57,14 |
|
12/2023 |
17,17 |
4,14 |
3,94 |
3,94 |
57,14 |
|
01/2024 |
17,64 |
4,20 |
4,00 |
4,00 |
42,86 |
|
02/2024 |
14,15 |
3,76 |
3,63 |
3,63 |
42,86 |
|
03/2024 |
9,98 |
3,16 |
2,99 |
2,99 |
57,14 |
|
04/2024 |
5,12 |
2,26 |
2,09 |
2,09 |
57,14 |
|
05/2024 |
2,33 |
1,53 |
1,46 |
1,46 |
42,86 |
|
06/2024 |
1,80 |
1,34 |
1,21 |
1,21 |
42,86 |
|
07/2024 |
1,02 |
1,01 |
0,84 |
0,70 |
42,86 |
|
08/2024 |
0,68 |
0,83 |
0,73 |
0,64 |
42,86 |
Appendix B: Results for lower and higher temperatures
Appendix B1: Results for temperature 0.5
Table B1: Variability measures for GPT-4o mini over horizon forecasts - Temperature 0.5.
|
Month |
SD t |
SD t+1 |
SD t+2 |
SD t+3 |
SD t+4 |
SD t+5 |
SD t+6 |
IQR t |
IQR t+1 |
IQR t+2 |
IQR t+3 |
IQR t+4 |
IQR t+5 |
IQR t+6 |
|---|---|---|---|---|---|---|---|---|---|---|---|---|---|---|
|
01/2023 |
0,2 |
0,2 |
0,3 |
0,3 |
0,4 |
0,4 |
0,4 |
0,5 |
0,3 |
0,5 |
0,4 |
0,4 |
0,5 |
0,5 |
|
02/2023 |
0,2 |
0,3 |
0,3 |
0,4 |
0,4 |
0,4 |
0,6 |
0,5 |
0,5 |
0,5 |
0,5 |
0,3 |
0,2 |
1,0 |
|
03/2023 |
0,0 |
0,0 |
0,1 |
0,1 |
0,2 |
0,2 |
0,3 |
0,0 |
0,1 |
0,2 |
0,3 |
0,4 |
0,5 |
0,6 |
|
04/2023 |
0,2 |
0,4 |
0,5 |
0,7 |
0,8 |
0,9 |
1,0 |
0,0 |
0,0 |
0,5 |
0,7 |
1,0 |
1,1 |
1,4 |
|
05/2023 |
0,0 |
0,0 |
0,3 |
0,7 |
1,1 |
1,4 |
1,8 |
0,0 |
0,0 |
0,4 |
1,3 |
2,1 |
3,1 |
3,8 |
|
06/2023 |
0,3 |
0,3 |
0,4 |
0,5 |
0,6 |
0,8 |
0,9 |
0,2 |
0,4 |
0,5 |
0,5 |
0,7 |
0,9 |
1,3 |
|
07/2023 |
0,4 |
0,5 |
0,6 |
0,6 |
0,6 |
0,7 |
0,7 |
0,6 |
0,7 |
1,0 |
1,2 |
0,9 |
1,0 |
1,0 |
|
08/2023 |
0,0 |
0,0 |
0,2 |
0,4 |
0,3 |
0,2 |
0,2 |
0,0 |
0,0 |
0,0 |
0,0 |
0,0 |
0,0 |
0,0 |
|
09/2023 |
0,8 |
0,6 |
0,5 |
0,5 |
0,5 |
0,5 |
0,6 |
1,5 |
0,5 |
0,5 |
1,0 |
1,0 |
1,0 |
1,0 |
|
10/2023 |
0,5 |
0,8 |
0,9 |
1,1 |
1,1 |
1,1 |
1,1 |
0,0 |
0,0 |
0,0 |
0,0 |
0,5 |
0,5 |
0,5 |
|
11/2023 |
0,3 |
0,6 |
0,7 |
1,1 |
1,3 |
1,5 |
1,7 |
0,5 |
1,0 |
1,0 |
1,0 |
1,0 |
0,5 |
0,5 |
|
12/2023 |
0,8 |
1,0 |
1,1 |
1,1 |
1,1 |
1,1 |
1,1 |
0,0 |
2,0 |
2,0 |
2,0 |
2,0 |
2,0 |
2,0 |
|
01/2024 |
4,3 |
4,5 |
4,8 |
4,5 |
4,3 |
4,1 |
3,4 |
10,0 |
7,0 |
5,0 |
3,0 |
0,0 |
2,0 |
3,0 |
|
02/2024 |
1,3 |
1,0 |
0,9 |
1,1 |
1,0 |
1,0 |
0,8 |
0,0 |
0,5 |
2,0 |
3,0 |
3,0 |
3,1 |
3,1 |
|
03/2024 |
1,1 |
0,8 |
1,1 |
1,6 |
2,3 |
2,5 |
2,9 |
0,0 |
0,0 |
2,0 |
1,0 |
2,0 |
2,5 |
2,5 |
|
04/2024 |
0,3 |
0,5 |
0,9 |
1,0 |
1,1 |
1,2 |
1,5 |
0,5 |
0,5 |
0,8 |
0,9 |
1,0 |
1,0 |
1,6 |
|
05/2024 |
0,3 |
0,4 |
0,5 |
0,7 |
0,8 |
1,0 |
1,2 |
0,0 |
0,0 |
0,0 |
0,0 |
0,0 |
0,1 |
0,1 |
|
06/2024 |
0,0 |
0,0 |
0,2 |
0,5 |
0,5 |
0,6 |
0,7 |
0,0 |
0,0 |
0,5 |
1,0 |
1,0 |
1,0 |
1,0 |
|
07/2024 |
0,1 |
0,1 |
0,2 |
0,3 |
0,3 |
0,2 |
0,3 |
0,0 |
0,0 |
0,3 |
0,5 |
0,2 |
0,2 |
0,0 |
|
08/2024 |
0,2 |
0,4 |
0,5 |
0,5 |
0,5 |
0,5 |
0,6 |
0,5 |
0,5 |
0,8 |
1,0 |
1,0 |
1,0 |
1,0 |
Table B2: Validation measures for GPT-4o mini mean and median forecasts - Temperature 0.5.
|
Month |
MSE (Mean) |
RMSE (Mean) |
MAE (Mean) |
MBE (Mean) |
Hit Rate (Mean) |
MSE (Median) |
RMSE (Median) |
MAE (Median) |
MBE (Median) |
Hit Rate (Median) |
|---|---|---|---|---|---|---|---|---|---|---|
|
01/2023 |
4,1 |
2,0 |
1,8 |
–1,8 |
42,9 |
4,7 |
2,2 |
2,0 |
–2,0 |
28,6 |
|
02/2023 |
8,8 |
3,0 |
2,1 |
–2,1 |
42,9 |
8,9 |
3,0 |
2,0 |
–2,0 |
42,9 |
|
03/2023 |
12,5 |
3,5 |
2,5 |
–2,4 |
42,9 |
13,1 |
3,6 |
2,6 |
–2,5 |
42,9 |
|
04/2023 |
8,9 |
3,0 |
2,2 |
–1,5 |
71,4 |
8,0 |
2,8 |
2,1 |
–1,3 |
71,4 |
|
05/2023 |
7,2 |
2,7 |
2,6 |
0,3 |
57,1 |
6,6 |
2,6 |
2,4 |
0,6 |
57,1 |
|
06/2023 |
51,4 |
7,2 |
4,8 |
–3,9 |
71,4 |
50,4 |
7,1 |
4,8 |
–3,8 |
71,4 |
|
07/2023 |
86,4 |
9,3 |
7,1 |
–7,1 |
57,1 |
87,6 |
9,4 |
7,1 |
–7,0 |
57,1 |
|
08/2023 |
101,7 |
10,1 |
8,5 |
–8,5 |
57,1 |
103,0 |
10,1 |
8,6 |
–8,6 |
57,1 |
|
09/2023 |
73,2 |
8,6 |
6,6 |
–6,0 |
71,4 |
73,7 |
8,6 |
6,6 |
–5,9 |
71,4 |
|
10/2023 |
46,1 |
6,8 |
4,8 |
–3,4 |
85,7 |
45,0 |
6,7 |
4,7 |
–3,3 |
85,7 |
|
11/2023 |
78,4 |
8,9 |
7,0 |
–6,3 |
71,4 |
81,5 |
9,0 |
7,2 |
–6,7 |
71,4 |
|
12/2023 |
45,1 |
6,7 |
5,1 |
–2,6 |
71,4 |
44,0 |
6,6 |
5,1 |
–2,4 |
71,4 |
|
01/2024 |
36,1 |
6,0 |
5,8 |
5,8 |
28,6 |
20,9 |
4,6 |
4,4 |
4,4 |
42,9 |
|
02/2024 |
31,1 |
5,6 |
5,5 |
5,5 |
42,9 |
25,1 |
5,0 |
4,9 |
4,9 |
42,9 |
|
03/2024 |
20,6 |
4,5 |
4,2 |
4,2 |
57,1 |
16,0 |
4,0 |
3,7 |
3,7 |
57,1 |
|
04/2024 |
21,4 |
4,6 |
4,4 |
4,4 |
42,9 |
21,3 |
4,6 |
4,5 |
4,5 |
42,9 |
|
05/2024 |
8,6 |
2,9 |
2,9 |
2,9 |
42,9 |
8,3 |
2,9 |
2,8 |
2,8 |
42,9 |
|
06/2024 |
0,8 |
0,9 |
0,8 |
–0,8 |
57,1 |
0,9 |
0,9 |
0,9 |
–0,9 |
57,1 |
|
07/2024 |
0,3 |
0,6 |
0,5 |
0,4 |
71,4 |
0,2 |
0,5 |
0,4 |
0,3 |
57,1 |
|
08/2024 |
0,9 |
1,0 |
0,9 |
0,7 |
42,9 |
0,8 |
0,9 |
0,8 |
0,7 |
42,9 |
Appendix B2: Results for temperature 1.5
Table B3: Variability measures for GPT-4o mini over horizon forecasts - Temperature 1.5.
|
Month |
SD t |
SD t+1 |
SD t+2 |
SD t+3 |
SD t+4 |
SD t+5 |
SD t+6 |
IQR t |
IQR t+1 |
IQR t+2 |
IQR t+3 |
IQR t+4 |
IQR t+5 |
IQR t+6 |
|---|---|---|---|---|---|---|---|---|---|---|---|---|---|---|
|
01/2023 |
0,5 |
0,5 |
0,5 |
0,5 |
0,5 |
0,6 |
0,7 |
1,0 |
0,9 |
0,9 |
0,6 |
0,5 |
0,9 |
1,0 |
|
02/2023 |
0,4 |
0,3 |
0,4 |
0,5 |
0,5 |
0,6 |
0,5 |
0,7 |
0,4 |
0,5 |
0,7 |
0,6 |
0,7 |
0,7 |
|
03/2023 |
0,2 |
0,1 |
0,2 |
0,2 |
0,3 |
0,3 |
0,4 |
0,0 |
0,1 |
0,2 |
0,2 |
0,5 |
0,4 |
0,5 |
|
04/2023 |
0,4 |
0,5 |
0,6 |
0,7 |
0,8 |
0,8 |
0,9 |
0,5 |
0,5 |
0,8 |
1,0 |
1,1 |
1,2 |
1,3 |
|
05/2023 |
0,2 |
0,3 |
0,5 |
0,7 |
1,0 |
1,2 |
1,5 |
0,1 |
0,3 |
0,8 |
1,2 |
1,6 |
1,7 |
1,7 |
|
06/2023 |
0,5 |
0,5 |
0,6 |
0,7 |
0,8 |
0,8 |
0,9 |
0,2 |
0,5 |
0,9 |
0,6 |
0,8 |
1,3 |
1,5 |
|
07/2023 |
0,4 |
0,4 |
0,4 |
0,4 |
0,5 |
0,7 |
0,9 |
0,5 |
0,5 |
0,5 |
0,5 |
0,8 |
1,1 |
1,4 |
|
08/2023 |
0,1 |
0,2 |
0,2 |
0,4 |
0,5 |
0,5 |
0,5 |
0,1 |
0,1 |
0,2 |
0,5 |
0,7 |
0,7 |
0,7 |
|
09/2023 |
1,5 |
1,4 |
1,3 |
1,3 |
1,2 |
1,1 |
1,2 |
2,0 |
1,4 |
1,6 |
1,4 |
1,5 |
1,0 |
1,2 |
|
10/2023 |
0,6 |
0,8 |
1,0 |
1,2 |
1,2 |
1,2 |
1,2 |
0,5 |
1,0 |
1,0 |
1,0 |
1,8 |
1,5 |
1,3 |
|
11/2023 |
0,6 |
0,9 |
1,1 |
0,9 |
1,0 |
1,0 |
1,0 |
0,5 |
1,0 |
1,8 |
1,0 |
1,5 |
1,4 |
1,4 |
|
12/2023 |
1,1 |
0,9 |
1,1 |
1,1 |
1,2 |
1,3 |
1,4 |
1,8 |
1,0 |
1,5 |
1,2 |
1,5 |
1,8 |
1,5 |
|
01/2024 |
4,5 |
4,9 |
4,8 |
4,9 |
4,6 |
4,3 |
4,2 |
6,0 |
7,0 |
7,5 |
7,0 |
6,0 |
6,0 |
5,0 |
|
02/2024 |
4,7 |
4,4 |
3,8 |
3,3 |
3,4 |
2,7 |
2,7 |
2,0 |
3,1 |
2,1 |
3,0 |
3,8 |
3,0 |
2,1 |
|
03/2024 |
2,1 |
2,0 |
2,0 |
2,6 |
3,1 |
3,7 |
3,8 |
3,5 |
1,5 |
2,0 |
3,0 |
3,5 |
3,5 |
3,0 |
|
04/2024 |
0,7 |
0,8 |
1,2 |
1,7 |
1,7 |
1,5 |
1,7 |
0,5 |
1,1 |
1,2 |
1,0 |
1,5 |
1,6 |
2,4 |
|
05/2024 |
0,7 |
1,0 |
1,3 |
1,7 |
1,4 |
1,7 |
1,9 |
1,0 |
1,0 |
1,0 |
1,8 |
2,5 |
2,5 |
2,7 |
|
06/2024 |
0,3 |
0,3 |
0,5 |
0,7 |
0,9 |
1,1 |
1,3 |
0,0 |
0,2 |
0,1 |
0,4 |
0,8 |
1,2 |
1,8 |
|
07/2024 |
0,3 |
0,3 |
0,4 |
0,6 |
0,8 |
1,0 |
1,2 |
0,3 |
0,3 |
0,5 |
0,5 |
0,9 |
1,0 |
1,0 |
|
08/2024 |
0,3 |
0,5 |
0,6 |
0,7 |
0,8 |
0,9 |
1,0 |
0,5 |
0,5 |
0,7 |
1,0 |
1,2 |
1,1 |
1,0 |
Table B4: Validation measures for GPT-4o mini mean and median forecasts - Temperature 1.5.
|
Month |
MSE (Mean) |
RMSE (Mean) |
MAE (Mean) |
MBE (Mean) |
Hit Rate (Mean) |
MSE (Median) |
RMSE (Median) |
MAE (Median) |
MBE (Median) |
Hit Rate (Median) |
|---|---|---|---|---|---|---|---|---|---|---|
|
01/2023 |
3,2 |
1,8 |
1,5 |
–1,5 |
42,9 |
3,0 |
1,7 |
1,5 |
–1,5 |
42,9 |
|
02/2023 |
7,4 |
2,7 |
1,8 |
–1,8 |
57,1 |
7,2 |
2,7 |
1,8 |
–1,8 |
42,9 |
|
03/2023 |
11,8 |
3,4 |
2,5 |
–2,3 |
57,1 |
11,9 |
3,5 |
2,5 |
–2,3 |
57,1 |
|
04/2023 |
8,3 |
2,9 |
2,1 |
–1,4 |
71,4 |
8,4 |
2,9 |
2,1 |
–1,4 |
71,4 |
|
05/2023 |
7,8 |
2,8 |
2,6 |
–0,1 |
57,1 |
8,3 |
2,9 |
2,7 |
–0,1 |
57,1 |
|
06/2023 |
51,8 |
7,2 |
4,8 |
–4,0 |
57,1 |
50,1 |
7,1 |
4,7 |
–3,8 |
71,4 |
|
07/2023 |
85,3 |
9,2 |
7,0 |
–7,0 |
57,1 |
85,7 |
9,3 |
7,0 |
–7,0 |
57,1 |
|
08/2023 |
99,0 |
9,9 |
8,4 |
–8,4 |
57,1 |
98,9 |
9,9 |
8,4 |
–8,4 |
57,1 |
|
09/2023 |
69,2 |
8,3 |
6,3 |
–5,8 |
71,4 |
69,9 |
8,4 |
6,4 |
–5,9 |
71,4 |
|
10/2023 |
47,9 |
6,9 |
4,9 |
–3,6 |
85,7 |
49,8 |
7,1 |
5,1 |
–3,8 |
85,7 |
|
11/2023 |
78,9 |
8,9 |
7,0 |
–6,1 |
85,7 |
79,3 |
8,9 |
7,0 |
–6,2 |
85,7 |
|
12/2023 |
46,3 |
6,8 |
5,2 |
–2,5 |
71,4 |
44,0 |
6,6 |
5,1 |
–2,4 |
71,4 |
|
01/2024 |
35,0 |
5,9 |
5,7 |
5,7 |
42,9 |
24,4 |
4,9 |
4,8 |
4,8 |
42,9 |
|
02/2024 |
58,3 |
7,6 |
7,5 |
7,5 |
42,9 |
51,9 |
7,2 |
7,1 |
7,1 |
42,9 |
|
03/2024 |
48,4 |
7,0 |
6,5 |
6,5 |
42,9 |
41,1 |
6,4 |
6,0 |
6,0 |
42,9 |
|
04/2024 |
23,8 |
4,9 |
4,7 |
4,7 |
42,9 |
21,8 |
4,7 |
4,5 |
4,5 |
42,9 |
|
05/2024 |
11,5 |
3,4 |
3,3 |
3,3 |
42,9 |
9,8 |
3,1 |
3,1 |
3,1 |
42,9 |
|
06/2024 |
0,6 |
0,7 |
0,7 |
–0,3 |
57,1 |
0,6 |
0,7 |
0,6 |
–0,5 |
71,4 |
|
07/2024 |
0,9 |
0,9 |
0,8 |
0,8 |
57,1 |
0,8 |
0,9 |
0,8 |
0,7 |
42,9 |
|
08/2024 |
1,1 |
1,1 |
1,0 |
0,9 |
42,9 |
1,5 |
1,2 |
1,1 |
1,1 |
42,9 |
1 https://github.com/agdaniela/AI-Inflation-Prediction/tree/master