La relación entre el COVID-19 y el riesgo de crédito: El estudio de caso de las compañías del EuroStoxx 50
The relationship between COVID-19 and the credit risk: a case study for EuroStoxx 50 companies
Cecilia Tellez Valle
Department of Financial Economics and Accounting. Pablo de Olavide University (Spain)
https://orcid.org/0000 0002-9098-0975
Margarita Martín García
Department of Financial Economics and Accounting. Pablo de Olavide University (Spain)
https://orcid.org/0000-0003-1301-7242
Filippo di Pietro
Department of Financial Economics and Operations Management. University of Sevilla (Spain)
https://orcid.org/0000-0003-1573-8553
José Luis Martín Marín
Department of Financial Economics and Accounting. Pablo de Olavide University (Spain)
https://orcid.org/0000-0003-2175-9107
RESUMEN
En este artículo se explora el impacto de la pandemia del COVID-19 en el riesgo de crédito de grandes compañías europeas. Se seleccionan las empresas incluidas en el índice EuroStoxx50 y aquellas cuyos CDS (derivado sobre incumplimiento de crédito) cotizan dentro del índice iTraxx Europe. A continuación, se aplica la metodología de estudio de eventos a las compañías de la muestra, eligiendo como evento de estudio el día de la declaración, por la OMS, del a pandemia, con una ventana de estimación de 120 días de negociación de mercado y una ventana de evento de +/- 10 días. Los resultados de CAR (rentabilidades anormales acumuladas) indican que el impacto en el riesgo de crédito de las compañías, medido por variaciones en las primas de los CDS es importante, y depende del sector al que pertenece la empresa.
PALABRAS CLAVE
Riesgo de crédito; CDS; estudio de eventos; pandemia Covid-19.
ABSTRACT
In this paper, we explore the impact of the COVID-19 pandemic on the credit risk of large European companies. We selected corporations belonged to the EuroStoxx 50 Index and whose CDS (Credit Default Swap) may be found in the iTraxx Europe Index. Then we applied the methodology of event studies to our database of companies, chosen as the event, the day of the declaration of pandemic by the WHO. The results indicate that the significance levels of the CAR (Cummulative Abnormal Default) show that the impact on the credit risk of the companies, as measured by the change in the spread of CDS, is important and depending on the sector in which the corporation is included.
KEYWORDS
Credit risk; CDS; event studies; Covid-19 pandemic.
Clasificación JEL: G14, G15, G23, G24.
MSC2010: 62M10, 62P20, 91B30, 91G10, 97K80
1. Introduction
The COVID-19 pandemic is not only having an impact on the lives of millions of people around the world but is also globally hitting the evolution of the economy. It is the first time in history that there has been a phenomenon that combines the lack of supply, paralysing the production chains due to the scarcity of raw materials, with the decrease in demand caused by the confinement of citizens.
Faced with this unprecedented situation, governments and public administrations are trying to mitigate the economic impact of the coronavirus by approving a series of measures to alleviate the economic slowdown caused by this virus.
The effects on the world economy are:
Direct impact on production volumes; disruptions and troubles to supply and distribution chains; increase in the price of raw materials and financial impact on companies and stock markets. This is impacting the markets, leading these companies to have a lower rating due to the increase of their risk. This increased risk will result in investment positions that will not be profitable under current conditions, further weakening confidence in the financial markets. Moreover, increased concern about counterparty risk causes disruption in the stock markets. Investors prefer to keep safer government securities, causing a significant decline in stock prices and corporate bonds.
The COVID-19 crisis is causing a fall in GDP and a considerable increase in public debt of almost all countries. Intuition should lead us to think that these macroeconomic data should drive a persistent credit risk, but this is not exactly the case. In the first wave, the 5-year premiums of sovereign Credit Default Swaps (CDS) increased considerably in countries with good credit ratings, although after this period, the impact of the pandemic on credit risk was cushioned, because of the measures taken by governments to support the economy.
The most relevant factors that are dampening the fact that the effects of the pandemic do not have an excessive impact on credit risk are:
The launch by the European Commission (27 May 2020) of an ambitious recovery plan at a European level, the NEXT Generation EU (NGEU).
The purchase of public debt by the European Central Bank (ECB) March 2020 to cover financing needs arising from the pandemic.
It should therefore be noted that the credit ratings of the countries of the Eurozone have not been greatly affected by this pandemic, so the financial markets determine a better credit rating than that derived from macroeconomic variables. Both the ECB and the aids at a European level have managed to cushion the expected increase in credit risk. In addition, the discrepancy between the discounted rating in the markets and that expected by the macroeconomic data is more relevant in the European countries most affected by the pandemic.
The objective of our research is to evaluate the impact of the COVID-19 pandemic on the credit risk of large European companies. We are going to use the spreads of CDS as a proxy for credit risk. We have selected companies included in the EuroStoxx 50 index, looking for the liquidity in the markets, and that have CDS which belong to the iTraxx European index. So, we obtain financial data that are reliable and relevant to our study. As for methodology we use the event study technique that is a well implanted way of analysing the influence of a given occurrence on the determined economic variables of a firm, in particular its market price.
Event studies are widespread in Finance and some authors may be quoted. For example, Alam et al. (2020) and Andres et al. (2021) who implement these studies using the spreads of CDS, which is rather new.
Our results point to the influence of the declaration of pandemic by the World Health Organization (WHO) on the CDS spreads of the selected European companies. In this way, a strong relationship between the COVID-19 pandemic and the increase of credit risk can be found at least in the European market. In short, we are using a methodology for measuring market risk to evaluate credit risk and as a model we do not select the CAPM but a simple linear regression.
The paper, about the impact of COVID-19 on credit risk, is structured as follows: First, a revision of the scientific literature about the subject is presented. Second, we analyse how, nowadays, the credit risk is measured, the importance of the CDS market and the use of indices such as those of the iTraxx family.
Third, we outline the methodology for event studies and their implementation. Fourth, we present the data of the Eikon database, and the periods of time considered. Finally, we show the results of the research and the conclusions obtained.
2. THEORETICAL BACKGROUND
Historically, there are many studies referring to the impact of any event on the price of the stocks in the market and on the price of bonds. Moreover, in the last decades some papers related to the impact on CDS prices may be found.
There are a wide range of references related to event study methodology. But there are two variables to consider, what kind of event it is and what asset is affected by it. Previous papers study many different events, such as any change in the corporate social responsibility ratings (Drago et al. 2018); and sovereign rating changes. Afonso et al., 2012; Galil et al., 2013, Norden & Weber, 2004; Wengner et al. 2015) analyse sovereign rating changes or their announcements. Bedendo & Colla (2015) and Ismailescu & Kazemi (2010) study the impact on developing countries. Binici et al. (2020) and Drago et al. (2018) report the impact of the public short sale disclosures on CDS spreads in 28 EU member states, for the first time. Lleshaj & Kocian (2020) use earning announcements, the same as Callen et al. (2009) and Zhang & Zhang (2013). Focusing on financial institutions, an object of study is banks’ bailouts externalities (Pop & Pop, 2009), and the disclosure of the list of other systematically important institutions by the European Banking Authority (EBA), which negatively affects bank CDS spreads (Andrie et al., 2020).
Related to the assets affected and in the context of bond credit ratings, following the event study methodology, an empirical test of market efficiency led to adjustments in the price, before and after the announcement date.
Previous research in the last century has analysed the impact of credit rating announcements on stock prices, (Goh & Ederington, 1993; Griffin & Sanvicente, 1982; and Pinches & Singleton, 1978); on bond prices, (Weinstein, 1977), and both stock and bond prices (Hand et al., 1992).
Focusing on the impact on stock prices, some of the studies find a negative reaction after downgrades, and abnormal performances during some weeks after the event. In the case of bonds, an anticipation and sometimes significantly negative abnormal returns before the event. In the present century, following the impact on stock prices, Badillo Amador et al. (2010) found significantly negative returns during the first month after a downgrade. As for the impact on bond prices, Steiner & Heinke (2001) noted significantly negative abnormal returns in these assets, 90 days before downgrades or negative outlooks.
In the last two decades there have been some approaches to the impact on CDS prices, the underlying subject being bonds suffering a change in their rating or in their outlook. Hull et al. (2004), in a pioneer paper, reported CDS spread changes predictive for downgrades by Moody’s. Norden & Weber (2004) studied the consequence on CDS and on bond prices from 2000 to 2002, finding a significant impact on both cases, with the downgrade’s announcements of Standard and Poor´s and Moody’s, while positive events do not seem to have a significant impact. The average time span of the following studies are four years and they use as a benchmark a model based on average (median or mean) CDS spreads by rating category: Blau & Roseman (2014), Galil et al. (2013), Lee et al. (2018) and Wengner et al. (2015), among others.
Bedendo & Colla (2015) uses the iTraxx Europe index and an average of sovereign CDS spreads of Eurozone countries. In the present paper we also consider the iTraxx index.
As an example, Kiesel & Kolaric (2018),with a sample of all US and European non-financial exchange listed firms with CDS, from January 2004 to December 2015, found that rating downgrades do not lead to any significant CDS spread changes, only watchlist placements for upgrades lead to an immediate reduction in CDS spreads.
Not only is the reaction of an event on CDS of corporate bonds studied, but also that on CDS of sovereign bonds after rating agency announcements (and on the volatility of CDS quotes by using exponential GARCH (1,1) models (Castellano & D’ecclesia 2013) and CDS on financial institutions with the time span of one year, the sample having 28 banks in King (2011) and 31 financial entities in Pop & Pop (2009).
We use CDS for the following reasons. Firstly, CDS are a direct measure of credit premia without considering any assumptions about the interest rate curve. Secondly, CDS refer to new contracts issued, whereas bond data refer to outstanding contracts. Thirdly, CDS spread responses more quickly to changes in credit conditions, (Blanco et al., 2005) and are less affected by liquidity risk (Longstaff, 2011).
As was mentioned above, almost all the previous research studies have as the analysed event any change in the credit rating of a bond or in their outlook, upgrade, or downgrade perspectives. Following this methodology, there are many events in many dates to consider and each one has an impact on the CDS, not in all of them.
What implies a degree of novelty in our paper is using the same event, on the same date, to all the assets. In this case, the date is that of the declaration of COVID 19 as a worldwide pandemic. We could find only one paper referring to this impact, but focusing on the Australian market (Alam et al., 2020). In this paper 8 industry indexes from the Australian Stock Exchange are given, with an event date on February 27th, 2020, the date of the COVID19 outbreak in Australia, and the same estimation and event windows that we use. They found positive returns on the day of the announcement in the following industries: food, pharmaceuticals and healthcare, and, after the announcement, telecommunications and again pharmaceuticals and healthcare.
3. Measuring credit risk
The problem with credit risk is the difficulty of measuring it. There are a lot of methods but, in general, they are rather complicated to implement and not too practical. For instance, the “distance to default” based on the Merton model requires too many calculations to be used extensively. On the other hand, the ratings given by the agencies’ lack of flexibility and their changes are rather slow.
The use of CDS, in fact contracts that permit protection against the default of bonds or other kind of debts, is also a way of indirectly measuring credit risk.
In this epigraph we are going to give a summary of the CDS market and also we will explain the characteristics of the CDS indices that are a logical evolution of the single-name contracts.
3.1 The CDS market
One of the most accepted ways of measuring credit risk nowadays is the use of CDS as we have already mentioned. CDS contracts are monitored by the International Swaps and Derivatives Association (ISDA) and are growing steadily after the outcome of the financial crisis in 2008. As is well known, in these contracts there are two parties, the buyer and the seller of protection against the default of a given bond or obligation. The use of the term “protection” is not accidental as there is a clear intention of avoiding the possibility that these contracts could be considered as insurance operations much more regulated and in need of the implementation of reserves. CDS markets are typically over the counter and until now not very regulated. Notwithstanding, there is at present a movement in the direction of the standardisation of contracts and the utilisation of clearing houses for their compensation.
In the classical CDS contract, the buyer of protection would pay to the seller a fixed amount or spread periodically, let us say quarterly, till the end of the contract or until the default of the underlying bond or obligation. In the last case, the protection seller would have to pay to the buyer a compensation in function of the recovery rate of the bond. But this was in the good old times.
Nowadays the way of pricing a CDS contract has changed radically. Now the spreads of the CDS are fixed for the single-name and the index contracts. For the single-name 100 or 500 bps fixed spreads are normal depending on the credit rating of the obligation. For index contracts the most usual is a fixed coupon of 100 bps. As the changes in the market is perhaps pricing the CDS differently, an upfront payment is necessary to close the deal. This payment will be made by the buyer of protection if the market is above the fixed coupon or by the seller if the market is under it. This is a way of standardising the contracts and is a move towards the use of a central clearing house.
3.2 The iTraxx CDS index
An alternative to single name is the CDS indices originated later in 2001 by the effort of investment banks such as J.P. Morgan and Morgan Stanley that were pioneers in this kind of credit market. At present the company Markit owns and manages an ample suite of CDS indices.
There are two families of indices, the Markit CDX for North America and the Markit iTraxx for Europe and Asia. The iTraxx Europe Index, also known as “The Main”, is composed of the most liquid 125 CDS referring to European investment grade bonds or obligations. There are other related indices such as the HiVol and the Crossover. The first is constituted by the 30 more risky CDS of The Main and the second is constructed by 40 to 50 sub-investment grade credits (IHS Markit, 2019). Also, sector indices are traded as NonFin (non-financials), SenFin (senior financials) and SubFin (sub financials).
In our study we use the iTraxx Europe Index as the most relevant contract representative of the big companies of the Eurozone and the United Kingdom. The trading occurs mostly in the over the counter (OTC) market but as of February 2013 the Intercontinental Exchange or ICE began offering central clearing of iTraxx products. The index has a roll date on September 20 and March 20 of each year and prior to these dates there is a revision of the composition of the contract. As an example, a contract that has a roll date of September 20 shall be issued with the maturity date of December 20 plus 3,5,7 or 10 years following this last date. Of all the possible maturities, that of five years is the most liquid and so most of the published studies select this tenor as we have also done.
The relevant rating of each underlying credit will be considered for the inclusion or exclusion of the CDS in the iTraxx Europe Index. The investment grade is accomplished with a rating of BBB of Standard & Poor`s and Fitch or Baa3 of Moody`s plus a positive or stable Outlook. Another condition is that the publicly traded debt securities of the CDS contracts amounts to 100 million euros or more with a maximum remaining maturity of 30 years. The standard contract on the index is for 10 million euros of credit protection on the companies for five years (Barley, 2008).
These rules for the trading of the iTraxx Europe index leads to the existence of different series of contracts. In our study we specifically use data of the series 31 and 32 with roll dates of 20 March and 20 September, respectively.
4. METHODOLOGY
This research relies on the event study method to analyse data. An event study is an empirical statistical method for investigating the relationship between stock prices and economic events (Dyckman et al., 1984). Stankevičienė & Akelaitis (2014) provide valuable evidence on how stock prices react to public announcements. Event studies may reveal how a stock market could be sensitive to a particular event. In their case studies of events, Brown & Warner (1985) suggest using 120 days prior to the event date as the estimated period, which is sufficient to form a baseline of normal returns. Hence, this report uses an estimation window of 120 days and a 10-day event window. Here, the day 0 refers to the announcement of the corona virus pandemic on March 11th 2020 by the WHO. Abnormal returns, the difference between the actual returns and the expected returns during the test period, can check the effects of a given event. Firstly, the daily return of each security price is calculated through the estimation and event windows, with the formula developed further on.
Event study methodology has been used to measure the impact of COVID-19 on the credit risk of companies. Since the two-pioneer paper of Ball & Brown (1968) and Fama (1969) the event study method has been widely used to investigate the impact of a specific “event” on the stock price of companies. Dyckman et al. (1984) describe an event study as an empirical statistical method to analyse the relationship between stock prices and economic events. An important factor contributing to the success of the Ball-Brown and Fama event studies is their use of the ‘market model’ derived after the then recently developed Capital Asset Pricing Model (CAPM) of Sharpe (1964). Event studies have been applied also to investigate the influence of firm-specific events on debtholder wealth. Bessembinder et al. (2009) present an overview of the studies of the influence of firm-specific events on bond prices using the event study methodology. They classify the study according to the level of analysis (bond or firm), methods to calculate excess return, statistical tests applied, time period and data source. Similar to Bessembinder et al. (2009), Andres et al. (2021) presents an overview of event studies applied to CDS data. They classify the studies according to the benchmark model, using the absolute or relative CDS spreads, and a statistical test is used for the significance of the abnormal returns. Looking at their table, it can be observed that different methods have been applied for the estimation of the abnormal returns. For example, indices based on average CDS spreads by rating category exist (Hull et al., 2004; Micu et al., 2004, Norden & Weber, 2004). We found market models, (Drago & Gallo, 2016; Lleshaj & Kocian, 2020, Loon & Zhong, 2014); rating-adjusted CDS spreads (Amiri-Moghadam et al., 2021; Finnerty et al., 2013) and matching models (Bertoni & Lugo, 2018; Pereira da Silva, 2016; Shivakumar et al., 2011). After an overview, the above-mentioned authors carry out a numerical experiment to test what method and statistical test to best apply for CDS data.
In this study we use relative CDS spreads that according to Andres et al. (2021) are the best option in most corporate studies. The daily relative CDS spread is the percentage change of daily spreads. The continuous compounding is applied by calculating the difference in the logarithm of daily spreads (1):
where: Si,t and Si,t-1 are CDS spreads.
The abnormal returns (AR) are estimated by a market model where the AR are estimated by the following equation (2):
where the E(Si,t ) is estimated by a regression model such as the following (3):
where: SiTrax is the spread of the index.
The data used for the regression analysis are the 120 daily CDS spreads before the event, and for the abnormal return a +-10-day as event window is used. This means that the CDS spreads used are from 10 days before the event to 10 days after the event (as stated in Figure 1).
This regression model is a linear one where shows the relationship between the spread of the CDS for companies belonging to Eurostoxx 50 and those of the iTraxx index, through time (previous to the event date, along the estimation window, is evaluated. In this case, β is the slope of the regression line. When the parameters α and β are computed, we use them to estimate the spreads of the CDS, E(Si,t ), along the event window given the iTraxx index in the market. Then, the Abnormal Returns along the event window are computed, following equation 2.
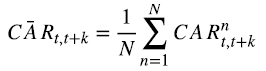
To adjust for uncertainties about the exact data of the event, especially for COVID-19 where the pandemic declaration was surrounded by days of rumours, and to get the impact on the CDS spread, the “abnormal return” is accumulated as Cumulative Abnormal Return (CAR) in a given period. The CAR for the CDS spreads return is calculated in the following way (4):
To test the significance of the results a statistical test is applied. To do it, before, the average CAR is estimated as follows (5):
where: N is the number of observations.
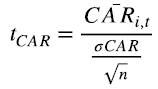
The below formula (6) estimates the t-statistics that are applied to measure the likelihood that the actual parameter is not zero, which is why we are using the t-student statistics for small samples.
5. DATA
To carry out the study data have been downloaded from the Eikon database. The companies selected are included in the EuroStoxx 50 index composed by the most capitalised entities in the European market shares. From the 50 companies only those also included in the iTraxx Europe Index for 5 years have been chosen, amounting to a total of 32. In Table 1 we can see a list of the mentioned companies.
Also in this table are represented the sectors involved from Consumer to Utilities; the countries of the companies; the CAR (-10,10); the t-student and the significance level. As for financial ratio, we have selected the “working capital/total assets” and “total liabilities/equity” referring to the 2019 exercise. Finally, the rating of Standard&Poor´s for the companies analysed are depicted with their last dates of revision.
Figure 1: Estimation and event windows
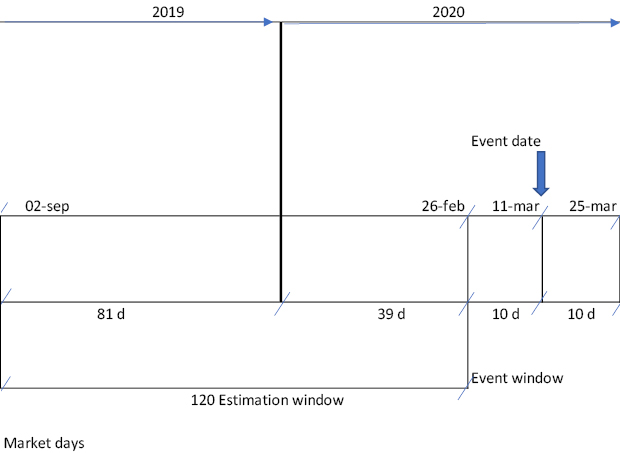
Source: Own elaboration
This study considers a 10-day event window for data analysis and so calculates the return for 10 market days before and 10 days after the announcement of the event date, i.e., the declaration of the pandemic by the WHO on 11th March 2020. Figure 1 shows the dates involved in our research.
6. RESULTS AND DISCUSSION
According to the results given in Table 1, CAR (-10;10), most companies have experimented a significative impact of the COVID-19 on their CDS spreads, but with important exceptions and differences in the effect. For example, insurance companies are very affected by the outburst of the pandemic.
Table 1. Companies selected and main parameters analysed. Cummulative Abnormal Return, CAR (-10;10)
|
COMPANIES |
SECTOR |
COUNTRIES |
CAR (-10;10) |
t-student |
Signif levels |
Working capital/Total Assets 2019 |
Total Liabilities/Equity 2019 |
S&P l/p foreign 11/3/20 |
|
|
AHOLD DELHAIZE |
5 |
NL |
0.246654049 |
3.750875867 |
*** |
–0.07278862 |
1.94610523 |
BBB |
24/06/2009 |
|
AIR LIQUIDE |
5 |
FR |
0.226384299 |
1.629011179 |
* |
–0.04939297 |
1.3140209 |
A- |
24/05/2016 |
|
ALLIANZ |
3 |
DE |
0.099310445 |
2.539090834 |
*** |
12.6644775 |
AA |
23/03/2009 |
|
|
ANHEUSER-BUSCH |
1 |
BE |
0.451496139 |
2.604270382 |
*** |
–0.02546821 |
2.1252212 |
BBB |
12/03/2018 |
|
AXA |
3 |
FR |
0.038740025 |
1.493602991 |
* |
10.1718386 |
A |
27/10/2016 |
|
|
BASF |
5 |
DE |
0.176437157 |
1.521610392 |
* |
0.16545141 |
1.09533219 |
A |
14/03/2016 |
|
BAYERN |
4 |
DE |
0.326445931 |
2.078785685 |
** |
0.07310539 |
1.67017967 |
BBB |
04/06/2018 |
|
BBVA |
3 |
ES |
0.2300000 |
1.652300 |
* |
0 |
13.3397504 |
A- |
01/04/2018 |
|
BMW |
5 |
DE |
0.355905726 |
1.765238579 |
** |
0.03510441 |
2.84387432 |
A+ |
09/12/2013 |
|
BNP PARIBAS |
3 |
FR |
0.305731567 |
1.565951472 |
* |
19.145673 |
A+ |
05/04/2019 |
|
|
DANONE |
1 |
FR |
0.419420995 |
1.762500739 |
** |
–0.02502094 |
1.63105388 |
BBB+ |
08/07/2016 |
|
DEUSTCHE_TELEKOM |
8 |
DE |
0.209782523 |
2.440262575 |
** |
–0.04818599 |
4.38278614 |
BBB+ |
19/05/2008 |
|
DAIMLER |
5 |
DE |
0.2400000 |
1.582780 |
* |
0.07273557 |
3.93019692 |
A- |
01/07/2021 |
|
ENEL |
9 |
IT |
0.340679389 |
4.178930874 |
*** |
–0.0220795 |
4.64328275 |
BBB+ |
06/12/2017 |
|
ENGIE |
9 |
FR |
0.36539637 |
3.681177412 |
*** |
0.01640873 |
3.82947986 |
A- |
29/04/2016 |
|
ENI |
9 |
IT |
0.3600000 |
1.921900 |
** |
0.0426523 |
1.5803215 |
A- |
01/08/2018 |
|
IBERDROLA |
9 |
ES |
0.258543457 |
1.010036066 |
–0.04554706 |
2.24773101 |
BBB+ |
22/04/2016 |
|
|
ING |
3 |
NL |
0.360926403 |
1.472591858 |
* |
15.5847235 |
A- |
02/12/2013 |
|
|
INTESA SANPAOLO |
3 |
IT |
0.580404849 |
1.149209888 |
13.5815823 |
BBB |
31/10/2017 |
||
|
KERING |
1 |
FR |
0.387671343 |
1.516017338 |
* |
–0.02236244 |
1.64136368 |
A- |
18/04/2019 |
|
LVMH |
1 |
FR |
0.225375304 |
1.5918983 |
* |
0.04027687 |
1.63781228 |
A+ |
10/12/2013 |
|
MUENCHENER RUCK |
3 |
DE |
0.395678409 |
1.457349629 |
* |
8.44065793 |
AA- |
23/03/2009 |
|
|
ORANGE |
8 |
FR |
0.233202531 |
1.452905745 |
* |
–0.02547435 |
2.35044755 |
BBB+ |
22/04/2013 |
|
PHILIPS ELTN |
4 |
NL |
0.231069059 |
1.143556387 |
0.09183447 |
1.14463761 |
|||
|
SANOFI |
4 |
FR |
0.588154277 |
1.746722882 |
** |
0.07300241 |
0.91291954 |
AA |
03/05/2013 |
|
SANTANDER |
3 |
ES |
0.225863408 |
1.734163215 |
** |
14.2161465 |
A |
06/04/2018 |
|
|
SIEMENS |
5 |
DE |
0.307750848 |
1.861086495 |
0.1307638 |
2.12197149 |
A+ |
05/06/2009 |
|
|
SOCIETE GENERAL |
3 |
FR |
0.297470413 |
1.591321038 |
* |
20.3500244 |
A |
23/06/2012 |
|
|
UNILEVER |
1 |
NL |
0.345565497 |
4.601201992 |
*** |
–0.07017869 |
3.91252274 |
A+ |
05/10/2000 |
|
VINCI |
2 |
FR |
0.2700000 |
1.342122 |
–0.03587188 |
0.13734056 |
A- |
01/03/2014 |
|
|
VIVENDI |
8 |
FR |
0.272985521 |
1.34212196 |
* |
–0.07821453 |
1.43248876 |
BBB |
27/07/2005 |
|
VOLKSWAGEN |
5 |
DE |
0.650000000 |
2.459795 |
*** |
0.04003311 |
3.00777625 |
BBB+ |
01/12/2015 |
Sectors: 1. Consumer 2. Energy 3. Financials 4. Healthcare 5. Industrials 6. Technologies 7. Materials 8. Telecoms 9. Utilities. Source: Own elaboration
A positive CAR means that after a piece of news, negative one in our case, there is a difference in price of CDS from the expected one. As a company’s credit default swap spread is the cost per annum for protection against a default by the company, CDS are financial instruments that hedge from credit risk, when the risk is higher, the cost of hedging should be higher than expected. There are some results in this sense, Hull et al. (2004) or Andres et al. (2021) found positive adjusted CDS spread changes at a negative rating events (another negative piece of news).
Figure 2. Cummulative Abnormal Return, CAR (-10,10) of selected companies
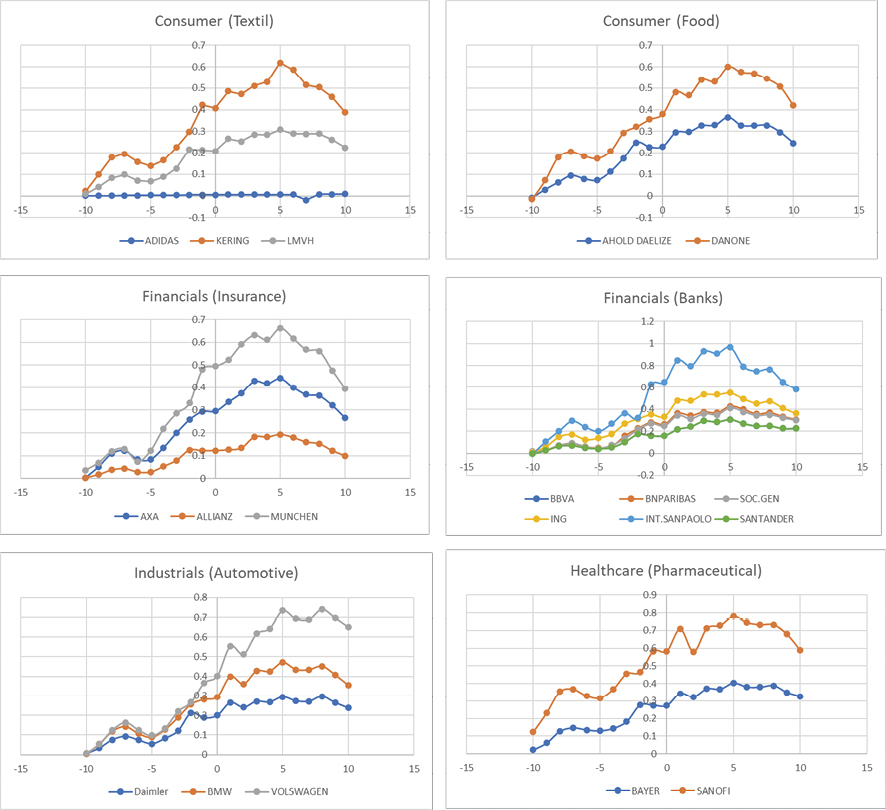
Source: Own elaboration
To better figure out the results, we have grouped some companies by sectors and, through a graphic, the difference between companies of the same sector is presented:
Figure 2 shows the grouped companies of six subsectors: Textile, Food, Insurance, Banks, Automotive and Pharmaceutical. The graphs report the cumulative effect in each period of 21 days around the announcement date. It is worth highlighting that a general tendency exists in each group but with different levels of intensity according to each company representation.
Some interesting features can be seen in Figure 2, The CAR of the companies in the event window presents a similar pattern. The CAR shows a maximum about five days after the event day, the exception being Adidas which seems unaffected by the declaration of the pandemic. After the fifth day the CAR decays in all the companies except for the abovementioned case. That means that the markets receive the pandemic announcement as a piece of bad news from the very beginning as the cost of a hedge on credit risk is higher than expected (CAR is going up after the event date). Beside of this, five days after the announcement it seems to reverse sometimes. This results are similar to those found by Andres et al. (2021).
We have worked out a series of tables of our results regarding chiefly data about the significance levels of the CAR (-10,10). In Table 2 we can see the 32 companies selected by sectors being financials, the most numerous, followed by industrials. The significance levels are rather low, 10 % predominating with 13 companies.
Given the sectors of the EuroStoxx 50 index, only two of them are not presented, technology and materials, the cause being the lack of companies whose CDS are quoted in the iTraxx Europe index on the day of the event.
In Table 3 are depicted the significance levels by countries, France and then Germany being the most representative. The presence of the countries is rather biased towards the large EU economies, but this is owing to the structure of the EuroStoxx 50 index. In Table 4 we show the relationship between the ratings and the significance levels. All the companies are investment grade and the most significative CAR (-10,10) appear in the stretch of A- to A+. When we descend to the stretch BBB- to BBB+ the significance levels at 1 % increase as could be expected. So, the connection between the ratings and the credit risk as measured by CDS spreads is confirmed.
Table 5 explains the connection between the significance of CAR (-10,10) and the leverage of the companies measured by the ratio “total liabilities/equity”. In general, lower leverages correspond to higher significance levels, which is contrary to what could be expected. This is the only table which presents some results that can be considered as abnormal.
Table 6 shows the relationship between the significance of CAR (-10,10) and the ratio “working capital/total assets” for non-financial companies, as this ratio is not suitable for banks and insurance companies. It can be seen that negative ratios increase the significance levels, which means than a non-orthodox funding leads to a greater sensitivity of a company’s CAR, which seems reasonable and according to the theory.
Finally, Table 7 shows the connection between the ratio “working capital/total assets”, for non-financial companies, and the sectors to which they belong. The negative ratios appear in the consumer sector, followed by telecom companies.
Table 2. CAR (-10, 10) Significance levels per sectors
|
Sectors (6) |
NS |
10 % |
5 % |
1 % |
Total |
|
1-Consumer |
– |
2 |
1 |
2 |
5 |
|
2-Energy |
1 |
– |
– |
– |
1 |
|
3-Financials |
1 |
6 |
1 |
1 |
9 |
|
4-Healthcare |
1 |
– |
2 |
– |
3 |
|
5-Industrials |
1 |
3 |
1 |
2 |
7 |
|
6-Technology |
– |
– |
– |
– |
– |
|
7-Materials |
– |
– |
– |
– |
– |
|
8-Telecom |
– |
2 |
1 |
– |
3 |
|
9-Utilities |
1 |
– |
1 |
2 |
4 |
|
Total |
5 |
13 |
7 |
7 |
32 |
Source: Own elaboration
Table 3. CAR (-10, 10) Significance levels per countries
|
Countries (8) |
NS |
10 % |
5 % |
1 % |
Total |
|
F-France |
1 |
8 |
2 |
1 |
12 |
|
G-Germany |
1 |
3 |
3 |
2 |
9 |
|
N-Netherlands |
1 |
1 |
– |
2 |
4 |
|
S-Spain |
1 |
1 |
1 |
– |
3 |
|
I-Italy |
1 |
– |
1 |
1 |
3 |
|
B-Belgium |
– |
– |
– |
1 |
1 |
|
Total |
5 |
13 |
7 |
7 |
32 |
Source: Own elaboration
Table 4. CAR (-10,10) Significance levels per rating
|
Ratings (5) |
NS |
10 % |
5 % |
1 % |
Total |
|
AA- to AA+ |
– |
1 |
1 |
1 |
3 |
|
A- to A + |
2 |
10 |
3 |
2 |
17 |
|
BBB- to BBB+ |
2 |
2 |
3 |
4 |
11 |
|
NR |
1 |
– |
– |
– |
1 |
|
Total |
5 |
13 |
7 |
7 |
32 |
Source: Own elaboration
Table 5. CAR (-10,10) Significance levels per ratio total liabilities/equity 2019
|
NS |
10 % |
5 % |
1 % |
||
|
1 to <2.5 |
4 |
6 |
4 |
2 |
16 |
|
2.5 to <5 |
– |
1 |
2 |
4 |
7 |
|
5 to <10 |
– |
1 |
– |
– |
1 |
|
10 to <15 |
1 |
2 |
1 |
1 |
5 |
|
15 to <20 |
– |
3 |
– |
– |
3 |
|
Total |
5 |
13 |
7 |
7 |
32 |
Source: Own elaboration
Table 6. CAR (-10,10) Significance levels per ratio working capital/ total assets 2019. Non-financial companies
|
NS |
10 % |
5 % |
1 % |
Total |
|
|
<0 |
2 |
4 |
2 |
4 |
12 |
|
0 to <0.05 |
– |
1 |
2 |
2 |
5 |
|
0.05 to<0.10 |
1 |
1 |
2 |
– |
4 |
|
0.10 to <0.15 |
1 |
1 |
– |
– |
2 |
|
Total |
4 |
7 |
6 |
6 |
23 |
Source: Own elaboration
Table 7. Working capital/total assets per sector 2019. Non-financial companies
|
1 |
2 |
4 |
5 |
8 |
9 |
Total |
|
|
<0 |
4 |
1 |
– |
2 |
3 |
2 |
12 |
|
0 to<0.05 |
1 |
– |
– |
2 |
– |
2 |
5 |
|
0.05 to<0.10 |
– |
– |
3 |
1 |
– |
– |
4 |
|
0.10 to<0.15 |
– |
– |
– |
2 |
– |
– |
2 |
|
Total |
5 |
1 |
3 |
7 |
3 |
4 |
23 |
Consumer 2. Energy 4. Healthcare. 5. Industrials 8. Telecom. 9. Utilities. Source: Own elaboration
7. CONCLUSIONS
The impact of the pandemic on the credit and market risks of companies is actually a singular event in history. In general, in financial studies the “event” is something punctual that happens in a company, let us say a rating downgrade or an increase in capital. In this way, event studies usually rest on the case of a single company and a certain happening.
In our study the situation is quite different as it refers to a pandemic global in character that is, fortunately, a non-frequent event. To find a similar situation we must go back to the Spanish Influenza of 1918. We have taken the day of the event as 11th March 2020 when the WHO declared the state of pandemic because of COVID-19.
The European companies selected have been those fulfilling two conditions: being in the EuroStoxx50 index and in the iTraxx European Index composed of 125 names, on the date of the event. In this way, we have chosen 32 European corporations of several sectors that may be considered as large companies with a great liquidity in the market.
Using the methodology of event studies, we have measured the impact of the declaration of the pandemic by the WHO in the CAR of the companies analysed. In fact, we used a similar scheme to that of the CAPM but calculating with CDS spreads instead of the stock prices. Using an estimation window of 120 market days and an event window of +/- 10 market days the results point to the following conclusions:
The announcement of the pandemic COVID 19 was discounted for the CDS market from the very beginning. That is, the cost of hedging of credit risk became higher and higher than it was expected by CAPM model along the first 5 days after the announcement date. Then, the tendency could change. We found similar results profile in those very first 5 days than Andres et al. (2021) with the issuer’s rating downgrades as their event whatever the model they use, as they got an increase in CAR in those dates.
The significance levels per sector at 1 % are shown more in the consumer, industrials and utilities companies. Per country Germany and Netherland have more corporations at the 1 % level.
The influence of the qualifications grades of the companies is that expected as minor ratings correspond to more significance levels at 1 %.
Comparing the significance levels with the leverage of the companies, measured by the ratio “total liabilities/equity” the results show that minor ratios correspond to higher significance levels. This is against what could be expected.
Finally, using the ratio “working capital/total asset” for the non-financial companies of the sample, the outputs show that corporations with negative ratios display higher significance levels. This means that a non-orthodox funding is being penalised.
In our opinion, the influence of the declaration of the pandemic on the credit risk of large European countries has been tested. The reaction of the spreads of CDS has been almost unanimous in the direction of their general increase. The CAR show a great deal of abnormal returns with high significance levels using the t-student distribution for small samples. We are measuring the reaction of the spreads of the companies to the announcement of the pandemic that depends a lot on the sector to which they belong to.
In a classical event study the election of the market model in the estimation window is fundamental. In general, the CAPM is the standard used as the studies are usually focused on the firm’s market risks. But in our case, the model is different as we try to measure the credit risk. In fact, we make use of a regression between the spread of the particular CDS and the spread on the index as can be seen in equation (3). We believe that this is original in our paper as only a few authors have followed this research methodology.
REFERENCES
, , & (2012). Sovereign credit ratings and financial markets linkages: Application to European data. Journal of International Money and Finance, 31(3), 606–638. https://doi.org/10.1016/j.jimonfin.2012.01.016
, & (2019). Sovereign risk evaluation for European Union countries. Journal of International Money and Finance, 103, 102-117. https://doi.org/10.1016/j.jimonfin.2019.102117
, , & (2020). COVID-19 outbreak and sectoral performance of the Australian stock market: An event study analysis. Australian Economic Papers, October, 1–14. https://doi.org/10.1111/1467-8454.12215
, , & (2021). The impact of stronger shareholder control on bondholders. Journal of Financial and Quantitative Analysis, 56(4), 1259-1295. https://doi.org/10.1017/S002210902000040X
, , & (2021). Measuring changes in credit risk: The case of CDS event studies. Global Finance Journal, 49, 100647. https://doi.org/10.1016/j.gfj.2021.100647
, , , & (2020). On becoming an O-SII (“Other Systemically Important Institution”). Journal of Banking and Finance, 111, 105723. https://doi.org/10.1016/j.jbankfin.2019.105723
, , & (2010). Spurious rejections by Dickey-Fuller tests in the presence of an endogenously determined break under the null. Revista de Métodos Cuantitativos Para La Economía y La Empresa, 9(June), 3–16. file:///C:/Users/ctelv/Downloads/2156-Texto del artículo-6739-1-10-20161026.pdf
, & (1968). An Empirical evaluation of accounting income numbers. Journal of Accounting Research, 6(2), 159–178. https://doi.org/https://doi.org/10.2307/2490232
(2008). Factbox-Five facts about the iTraxx Europe index. U.S Market News. https://www.reuters.com/article/itraxx-idUKL1211809720080212
, & (2015). Sovereign and corporate credit risk: Evidence from the Eurozone. Journal of Corporate Finance, 33, 34–52. https://doi.org/10.1016/j.jcorpfin.2015.04.006
, & (2018). Detecting abnormal changes in credit default swap spreads using matching-portfolio models R. Journal of Banking and Finance, 90, 146–158. https://doi.org/10.1016/j.jbankfin.2018.03.009
, , , & (2009). Measuring abnormal bond performance. Review of Financial Studies, 22(10), 4219–4258. https://doi.org/10.1093/rfs/hhn105
, , & (2020). Market price effects of agency sovereign debt announcements: Importance of prior credit states. International Review of Economics and Finance. 69. 769-787. https://doi.org/10.1016/j.iref.2020.04.005
, , & (2005). An empirical analysis of the dynamic relation between investment-grade bonds and Credit Default Swaps. The Journal of Finance, LX (5, October), 2255–2281.
, & (2014). The reaction of European credit default swap spreads to the U.S. credit rating downgrade. International Review of Economics and Finance, 34, 131–141. https://doi.org/10.1016/j.iref.2014.07.009
, & (1985). Using daily stock returns. The case of event studies. Journal of Financial Economics, 14(1), 3–31. https://doi.org/10.1016/0304-405X(85)90042-X
, , & (2009). The impact of earnings on the pricing of credit Default swaps. Accounting Review, 84(5), 1363–1394. https://doi.org/10.2308/accr.2009.84.5.1363
, & (2013). CDS volatility: the key signal of credit quality. Annals of Operations Research, 205, 89–107. https://doi.org/10.1007/s10479-012-1244-9
, , & (2019). Do corporate social responsibility ratings affect credit default swap spreads?, Corporate Social Responsibility and Environmental Management. 26. 644-652. https://doi.org/10.1002/csr.1709
, & (2016). The impact and the spillover effect of a sovereign rating announcement on the euro area CDS market. Journal of International Money and Finance. 67. 264-286. https://doi.org/10.1016/j.jimonfin.2016.06.004
, , & (1984). A comparison of event study methodologies using daily stock returns: A simulation approach. Journal of Accounting Research, 22, 1–30. https://doi.org/https://doi.org/10.2307/2490855
(1969). Efficient Capital Markets: A review of theory and empirical work. The Journal of Finance, 25(2), 383–417. https://doi.org/10.2307/2325486
, , & (2013). The impact of credit rating announcements on Credit Default Swap spreads. Journal of Banking & Finance, 37(6), 2011–2030. https://doi.org/10.1016/J.Jbankfin.2013.01.028
, , , & (2013). The determinants of CDS spreads. Journal of Banking and Finance. 41. 271-282. https://doi.org/10.1016/j.jbankfin.2013.12.005
, & (1993). Is a bond rating downgrade bad news, good news, or no news for stockholders? The Journal of Finance, 48(5), 2001–2008. https://doi.org/10.1111/j.1540-6261.1993.tb05139.x
, & (1982). Common stock returns and rating changes: A methodological comparison. The Journal of Finance, 37(1), 103–119. https://doi.org/10.1111/j.1540-6261.1982.tb01098.x
, , & (1992). The effect of bond rating agency announcements on bond and stock prices. The Journal of Finance, 47(2), 733–752. https://doi.org/10.1111/j.1540-6261.1992.tb04407.x
, , , & (2004). The relationship between credit default swap spreads, bond yields, and credit rating announcements. Journal of Banking and Finance. 28. 2789-2811. https://doi.org/10.1016/j.jbankfin.2004.06.010
. (2019). iTraxx Europe and iTraxx Crossover index rules (Issue August).
, & (2010). The reaction of emerging market Credit Default Swap spreads to sovereign credit rating changes. Journal of Banking and Finance, 34(12), 2861–2873. https://doi.org/10.1016/j.jbankfin.2010.05.014
, & (2018). Measuring the effect of watch-preceded and direct rating changes: a note on credit markets. Review of Quantitative Finance and Accounting, 50, 653–672. https://doi.org/10.1007/s11156-017-0641-1
(2011). Time to buy or just buying time? the market reaction to bank rescue packages. SSRN Electronic Journal, 288, Article 288. https://doi.org/10.2139/ssrn.1481578
, , & (2018). When do CDS spreads lead? Rating events, private entities, and firm-specific information flows. Journal of Financial Economics, 130(3), 556–578. https://doi.org/10.1016/j.jfineco.2018.07.011
, & (2020). . The European Journal of Finance. 27 (11), 1117-1150. https://doi.org/10.1080/1351847X.2020.1858129
(2011). How sovereign is sovereign credit risk? American Economic Journal, 3(April), 75–103.
, & (2014). The impact of central clearing on counterparty risk, liquidity, and trading: Evidence from the Credit Default Swap market. Journal of Financial Economics, 112(1), 91–115. https://doi.org/10.1016/j.jfineco.2013.12.001
, , & (2004). The price impact of rating announcements: evidence from credit default swap market. BIS Quarterly Review, June. 55-65.
, & (2004). Informational efficiency of Credit Default Swap and stock markets: The impact of credit rating announcements. Journal of Banking and Finance, 28(11), 2813–2843. https://doi.org/10.1016/j.jbankfin.2004.06.011
(2016). Earnings surprises and the response of CDS markets. Studies in Economics and Finance, 33(3), 377–402. https://doi.org/10.1108/SEF-11-2014-0217
, & (1978). The adjustment of stock prices to bond rating changes. The Journal of Finance, 33(1), 29–44. https://doi.org/10.1111/j.1540-6261.1978.tb03387.x
, & (2009). Requiem for market discipline and the specter of TBTF in Japanese banking. Quarterly Review of Economics and Finance, 49(4), 1429–1459. https://doi.org/10.1016/j.qref.2009.08.001
(1964). Capital Asset Prices: A theory of market equyilibrium under conditions of risk. The Journal of Finance, 18(3), 425–442. https://doi.org/10.2307/2977928
, , , & (2011). The debt market relevance of management earnings forecasts: evidence from before and during the credit crisis. Review of Accounting Studies, 16(3), 464–486. https://doi.org/10.1007/s11142-011-9155-6
, & (2014). Impact of public announcements on stock prices: relation between values of stock prices and the price changes in Lithuanian stock market. Procedia - Social and Behavioral Sciences, 156(April), 538–542. https://doi.org/10.1016/j.sbspro.2014.11.236
, & (2001). Event study concerning international bond price effects of credit rating actions. International Journal of Finance and Economics, 6(2), 139–157. https://doi.org/10.1002/ijfe.148
(1977). The effect of a rating change announcement on bond price. Journal of Financial Economics, 5(3), 329–350. https://doi.org/10.1016/0304-405X(77)90042-3
, , & (2015). The impact of credit rating announcements on corporate CDS markets-Are intra-industry effects observable? Journal of Economics and Business, 78, 79–91. https://doi.org/10.1016/j.jeconbus.2014.11.003
, & (2013). Information efficiency of the U.S. Credit Default Swap market: Evidence from earnings surprises. Journal of Financial Stability, 9(4), 720–730. https://doi.org/10.1016/j.jfs.2011.10.005