Analizando la relación entre la eficiencia y la rentabilidad en el mercado de seguros no vida.
Studying the relation between efficiency and profitability in the non-life insurance market
Sara Suárez Fernández
University of Oviedo (Spain)
https://orcid.org/0000-0003-2894-3732
Raquel Quiroga García
University of Oviedo (Spain)
http://orcid.org/0000-0002-5435-5769
Isabel Manzano Pérez
University of Oviedo (Spain)
https://orcid.org/0000-0001-6241-6229
RESUMEN
En los últimos años, el estudio del mercado asegurador se ha focalizado únicamente en analizar su eficiencia o su rentabilidad, pero hasta ahora no se ha abordado la relación entre ambas, al menos para el mercado asegurador español. En este trabajo, tratamos de contribuir al estudio conjunto de esas dos variables examinando la relación entre las puntuaciones de eficiencia obtenidas mediante un DEA en dos etapas y los valores de los ratios financieros habituales en este sector (ROE, ROA, Ratio Técnico, Ratio Combinado y Ratio de Siniestralidad). Para ello, utilizamos una muestra de 111 empresas del mercado español de seguros de no vida para el periodo 2008-2017. Nuestros resultados muestran una relación positiva entre eficiencia y rentabilidad que presenta rendimientos decrecientes, siendo el efecto positivo de la eficiencia sobre los ratios de beneficio menor para las empresas más eficientes.
PALABRAS CLAVE
Eficiencia; Rentabilidad; Seguro; Análisis Envolvente de Datos.
ABSTRACT
Previous literature on business performance in the insurance market tends to focus only on efficiency or profitability. However, the relationship between both has yet to be addressed in the Spanish insurance market. This paper examines the relationship between efficiency scores obtained through a two-stage DEA and the values of the classical financial ratios (ROE, ROA, Technical Ratio, Combined Ratio and Loss Ratio). We use a sample of 111 firms from the non-life Spanish insurance market from 2008-2017. We find a positive relationship between efficiency and profitability, which shows decreasing returns, with the positive effect of efficiency on profit ratios being lower for the most efficient companies.
KEYWORDS
Efficiency; Profitability; Insurance; Data Envelopment Analysis.
1. INTRODUCTION
Insurance companies develop a double activity with very different characteristics. On the one hand, it is a pure insurance action by which new policies are subscribed and services are provided to the new and the existing ones. On the other, an investment management activity, such as the trading of derivatives, the loan and management of assets and the provision of financial services (Cummins and Weiss, 2014). Consequently, when evaluating insurers’ performance, both dimensions, underwriting results and investment results, should be considered (Swiss, 2018; Rubio-Misas, 2020). Moreover, as explained in Camino-Mogro et al. (2019), the insurance sector has an important role in the economy, and it has been growing steadily in recent decades, being a relevant field for research.
As any other enterprise, insurers generate the capital needed to develop their activity by conducting profitable operations. Beyond that, an efficient insurer using its resources usually shows higher competitiveness and, generally, a better performance. This fact justifies the importance of applying different methodologies to evaluate the efficiency achieved by insurers in developing their economic activity (Greene and Segal, 2004; Eling and Jia, 2019). Bearing this in mind, the main aim of this paper is to analyze the relationship between efficiency and financial profitability of insurance companies. As far as these authors know, this is the first paper studying efficiency and profitability jointly for the Spanish insurance market.
The evaluation and the analysis of efficiency are essential for any organization, either public or private, since the objective of all of them is to optimize the allocation of their resources, maximizing their results by managing these resources in the best possible way. Furthermore, studying efficiency is crucial in the insurance industry, given the existence of a competitive environment with specific regulations and standards that insurers must comply with. The inefficiency of a company, generated by an inadequate use of its available resources, negatively impacts its profits and cash flows, which translates into a worse company value through lower dividends or fewer investments, consequently damaging its potential growth.
The relevance of assessing efficiency in the insurance market explains the existence of numerous studies about it and the different methodologies employed. Two main approaches can be applied: parametric and non-parametric procedures. The classical parametric approach is the Stochastic Frontier Analysis (SFA), and the non-parametric line is the Data Envelopment Analysis (DEA). The principal difference between them is that DEA models do not require defining a priori the functional form of the efficient frontier. Parametric estimation methods, on the contrary, involve specifying a particular functional form for the production function. This approach estimates the frontier parameters using mathematical programming or econometric techniques (Alvarez-Pinilla, 2001).
An alternative to the original DEA is the two-stage DEA of Kao and Hwang (2008), which is designed for two-stage production processes. In this procedure, the first stage estimates a regular DEA. In the second stage, another DEA is estimated where the outputs from the first DEA become the inputs of the second DEA, called intermediate inputs. Following this approach, the overall efficiency of a firm comes from the product of the efficiency scores obtained in each stage. A recent example of an application of two-stage DEA in the financial sector is Vera-Gilces et al. (2021). Kao and Hwang (2008) consider insurance companies as a two-stage business. In the first stage, the insurer acquires premiums and other assets to make different investments, and in the second stage, the company manages these investments to generate profits. Numerous authors have used this methodology, as it is the case of Kao and Hwang (2008) and Chen et al. (2009) for the non-life insurance companies of Taiwan, Shahroudi et al. (2012) who measure the efficiency of private insurance companies in Iran, or Eling and Jia (2019) in their paper about efficiency and profitability in the global insurance industry, determining the efficiency level of life and non-life insurance companies.
While new methodologies arise, so do the number of papers examining companies’ efficient or inefficient performance. Looking at the literature, SFA and DEA have been widely used both to study the efficiency of insurance markets and also to make comparisons between countries, organizational forms, company sizes or considering life and non-life insurers, for example, in Eling and Luhnen (2010a,b); Ferro and León (2017); Suarez-Fernandez et al. (2021). A literature review on insurance efficiency can be found in Eling and Luhnen (2010a) for the European and American markets and in Mose (2013) for Asian and African markets. More recently, Kaffash et al. (2020) reviewed DEA applications to study insurance efficiency, while Gaganis et al. (2013) employed SFA to conduct a cross-country study considering 52 countries worldwide.
Also applying SFA, Alhassan and Biekpe (2016) explore the South African insurance market, and Ferro and León (2017) examine the non-life Argentinian insurance market. Nevertheless, regardless of the advantages and disadvantages of each method, several studies have proven that there are no significant differences between the efficiency scores obtained using DEA or SFA procedures (Cummins and Zi, 1998; Eling and Luhnen, 2010b; Suarez-Fernandez et al., 2021).
Despite the importance of efficiency in the insurance sector, efficiency is not the only matter of interest when evaluating an insurer’s performance, as profitability is also a relevant topic. To analyze any insurer’s solvency and viability, regulators commonly rely on financial reports made mostly of financial ratios (Greene and Segal, 2004).
The insurance sector, like the banking sector, provides a large number of different financial services. These two sectors are involved in the risk market and play a fundamental role in economic growth. In this sense, the existence of a well-developed and profitable insurance sector provides long-term funds for the development of activities and infrastructures (Charumathi, 2012). Profitability in any enterprise is an indicator of the ability of the company to generate profits, favoring its sustainability. Companies with high profitability will gain a competitive advantage compared to those with low profitability (Azmi et al., 2020).
Insurance profitability has been the focus of numerous papers. For example, Moro and Anderloni (2014) analyze the profitability of 198 European insurers and conclude that size, diversification, and reinsurance activity have an essential impact on ratios such as ROE and ROA. Similar research is that of Kramaric et al. (2017) and Pjanic et al. (2018) for various Central and Eastern European countries, or that of Azmi et al. (2020) for the Indonesian insurance market, who also make an extensive review of previous literature. González-Fernández et al. (2023) also analysed profitability in the non-life insurance market and linked it to variables such as the level of maturity or the crisis/non-crisis of the different countries they have chosen. All these studies follow an econometric approach to investigate the factors that determine profitability, pointing to size, diversification, reinsurance, claims, premium growth, or underwriting results as the most critical aspects. Assessing a business’ performance implies considering variables further than the sum of the number of inputs and outputs considered in calculating efficiency. To analyze financial profitability, papers like Eling and Jia (2019) and Venkateswarlu and Bishma Rao (2016) use ratios such as ROE, ROA, Combined Ratio, Leverage Ratio or Profit Ratio, among others. Therefore, this paper employs the financial and operating ratios most frequently used in the non-life insurance sector.
The main purpose of this paper is to examine the relationship between efficiency levels and financial profitability in the non-life Spanish insurance market using a sample of 111 insurers between 2008 and 2017 (unbalanced panel data). This question has been explored previously in the insurance industry in the branch of life Greene and Segal (2004), non-life Leverty and Grace (2010), and in both sectors Eling and Jia (2019), finding a positive efficiency-profitability (E-P) relationship. Accordingly, our first research question is based on the hypothesis that efficiency and profitability are positively related.
As mentioned before, while most authors studying efficiency in the insurance sector are focused on learning how companies manage their available resources, those who analyze insurers’ profitability usually focus on the outcomes of that management. That means focusing on business profits, which are measured through financial ratios. So, Jarraya et al. (2023) study the efficiency scores of production factors for 250 European non-life insurance companies and relate this with profit. One would expect efficiency in management and financial profitability to be positively correlated since it is probable for companies to mishandle their resources to be inadequately managed and to perform inefficiently, thus obtaining poor outcomes and weak financial ratios. In this sense, the most efficient companies are expected to be the most profitable and show the best results. However, it should be considered that the procedures typically employed to measure efficiency, like the DEA or the SFA, approximate the relation between inputs and outputs by comparing a particular firm’s performance and the benchmark practices in the reference market. Instead, financial ratios reflect each company’s behaviour, considering only its overall activity (Eckles and Pottier, 2011).
The study of the E-P relation in the Spanish insurance market is the purpose of our first research question, which we state as follows:
RQ1. Are the efficiency and profitability of non-life insurance companies in the Spanish market positively related?
Once the relationship between E-P has been established, one would wonder whether this relationship is constant, being the contribution of efficiency to the growth of profitability always the same, or if there is, as pointed out in Eling and Jia (2019), a decreasing marginal relation (law of diminishing returns), being the increase in profitability lower when it occurs in the most efficient companies and greater for the least efficient ones. This is the topic of our second research question, which we state as:
RQ2. Is the relation between efficiency and profitability in the Spanish non-life insurance market constant, or does it follow the law of diminishing marginal returns?
In addition to these research objectives, in this article, we also study the role that variables such as diversification or the organizational structure of the company play in the efficiency and performance of an insurer. Traditionally, the decision to operate in a diverse number of business lines, that is, the level of diversification of the company, has been considered a suitable indicator of profitability and good business management. Diversification allows firms to exploit economies of scope and risk reductions (Moro and Anderloni, 2014). On the other hand, higher degrees of diversification are linked to large firms with complex organizational structures and, in general, high management costs. This could result in inefficiency and lower profitability compared to smaller but more specialized firms (Liebenberg and Sommer, 2008). Liebenberg and Sommer (2008) conclude that undiversified insurers perform better than diversified ones, and Bikker and Gorter (2011) point out that specialized insurers have significantly lower costs than non-specialized firms. The relation between diversification and efficiency is also still being determined. Cummins et al. (2010) find non-diversified insurers more efficient, while others, such as Berger et al. (2000), do not find any significant relationship. Our third research question aims to shed light on this debate and is stated as follows:
RQ3. Does diversification contribute to more efficient and profitable insurers in the Spanish non-life insurance sector?
Two types of ownership coexist in the Spanish insurance market: private companies (stocks) and mutuals. The relationship between the organizational structure and the efficiency or profitability of a company in the insurance market has been widely analyzed in the previous literature. However, there is no consensus on whether the organizational structure influences the efficiency or performance of the insurer. So far, previous studies, such as that of Fecher et al. (1993) or Cummins and Zi (1998), find no significant differences between stocks and mutuals regarding efficiency. More recent papers, such as Cummins and Nini (2002) or Gaganis et al. (2015), state that stocks are more profitable than mutuals, also showing a better performance. Biener and Eling (2012) find mixed results when studying this issue in an international context. Cummins et al. (2004) suggest better behavior in mutual insurers for the Spanish market. In this line, our fourth research question attempts to clarify this relationship and is stated as follows:
RQ4. Does the type of firm ownership affect the efficiency and profitability of insurers in the Spanish Non-Life sector?
The paper is structured as follows: first, Section 2 gives an overview of the methodology used; afterwards, Section 3 summarizes the main descriptive statistics of the Spanish insurers’ dataset; then, in Section 4, a brief review of the Spanish insurance market is given, while in Section 5 the results are presented, and in Section 6 we discuss our conclusions.
2. METHODOLOGY
We calculate the efficiency levels for each insurer using a two-stage DEA to assess the relation between E-P in the Spanish insurance market and the profitability ratios.
Data Envelopment Analysis (DEA) is an approach which measures the relative efficiency of peer Decision Making Units (DMUs) that have multiple inputs and outputs. Efficiency is measured as the distance of a firm from the efficient frontier, formed by those firms that use the minimum number of inputs to produce a given number of outputs (input-oriented model). As an extension of the traditional DEA, the two-stage DEA model assumes that the production process can be decomposed into two sub-processes connected as a sequence. The efficiency of the entire process can be decomposed into the product of the efficiencies of each of the two sub-processes. This approach was initially developed by Kao and Hwang (2008) for the non-life insurance market in Taiwan. These authors compare the efficiency obtained with this model with that resulting from applying two successive independent DEA models, finding that their model, where the two stages are connected, is more reliable in assessing efficiency. Considering that this model better captures the specific production process in the insurance market, in this paper, we employ a two-stage DEA model to calculate the efficiency scores, as done by Chen et al. (2009) or Eling and Jia (2019), among others.
To conduct the econometric analysis, we use Kao and Hwang’s two-stage DEA approach to calculate efficiency, which assumes constant returns to scale. In this model, some initial inputs are defined for the first stage, and the outputs resulting from this first stage will be considered as inputs in the second stage. These outputs from the first stage used as inputs in the second stage are called intermediate inputs.
The production process is composed of two sub-processes. For measuring the efficiency of DMU K (EK), we solve the mathematical programs (1a) and (1b), achieving the efficiency of the sub-process ( ). Denote as Xik, i = 1,...., m the m inputs used to produce s outputs Yrk, r = 1,..., s and be Yrk, p = 1,..., q, the intermediate products.
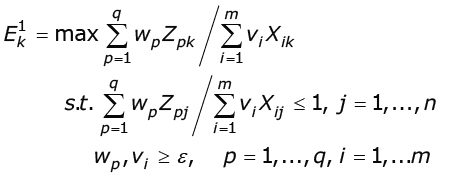
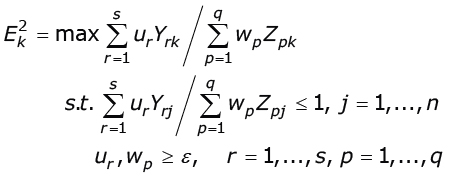
The overall efficiency is the product of efficiencies of the two sub-processes 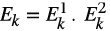 . Insurance companies use earned premiums as capital for investment in the insurance industry. Therefore, the production process can be divided into two sub-processes: acquiring premiums and generating profits. Accordingly, since the insurance industry has a typical two-stage production process structure, the two stage-DEA methodology is optimal for modeling the calculation of efficiency in this particular market.
Figure 1. Inputs, intermediate inputs and outputs employed in the two-stage DEA model.

In this paper, we use the most common inputs and outputs in the non-life insurance sector, as shown in Kao and Hwang (2008), Shahroudi et al. (2012), and Eling and Jia (2019). These variables are presented in Figure 1.
The inputs chosen for the first stage, which allow getting premiums and help attract customers, are the following:
•Operation expenses: the employees’ wages and various costs incurred in the company’s daily operations.
•Insurance expenses: the expenses paid to agencies, brokers, and solicitors, and other expenses associated with the marketing services of the insurance.
The outputs of the first stage, which are the intermediate inputs in the model, are the Net written premiums, which include the reinsurance activity.
Finally, the outputs of the second stage are the following:
•Underwriting profit: profits earned from the insurance business.
•Investment profit: profits earned from the investment portfolio.
As a second step, we assess the relationship between insurers’ efficiency levels and profitability ratios. To do so, we use a random effects model to regress each profitability ratio using efficiency as an explanatory variable. We use random effects (RE) since firm fixed effects models do not allow for time invariant independent variables, so these models cannot identify the different effects of efficiency on profitability between insurers. When studying insurance markets using panel data, random effects models are more oriented to assess the cross-sectional effects among firms, while fixed effects models are better at getting firm specific dynamics over years (Eling and Jia, 2019).
To overcome temporal autocorrelation, the contemporary correlation between panels, heteroskedasticity and unit root problems that could appear when using RE estimators, we also use Panel Corrected Standard Errors (PCSE) and a Feasible Generalized Least Squared (FGLS), following Camino-Mogro and Bermudez-Barrezueta (2019).
We estimate the following equation (1):

We included the square term of the firm’s efficiency scores to allow for a non-linear relation between E-P ratios. Additionally, Xi,t is a vector of control variables. This vector includes a group of dummy variables for mutuals, Mutual, diversified insurers, Diversified, years of economic crisis, Negative GDP growth, the evolution of the market share, and Market share expansion. This control variable set includes the natural logarithm of firms’ total assets, Total Assets, and three insurance ratios, Premium Growth Ratio, Financial Leverage Ratio and Premium Retention Ratio. The definition and the formulas of the three insurance ratios are detailed in Section 3.
3. DATABASE
Our data comes from the Dirección General de Seguros y Fondos de Pensiones (DGSFP) dataset, which the Spanish regulatory and supervisory authority publishes annually. This dataset includes Balance Sheets and Accounts of all the insurance companies authorized to operate in the Spanish market. It is an unbalanced panel which comprises 111 insurers for the period 2008-2017. In this paper, we focus on the behavior of non-life insurers, including those who simultaneously operate in life and non-life lines of business but excluding reinsurance entities. Table 1 shows the main characteristics of the insurers considered.
As explained in Section 2, to conduct the two-stage DEA, we use insurance and operation expenses as inputs and net premium written as the intermediate input. The outputs for the second stage are underwriting profits and investment profits (see Table 1).
First, we assess the efficiency of the non-life Spanish insurance market and then explore the relationship between efficiency levels and the performance of the insurers. To do so, several financial ratios have been calculated. In what follows, we sum up the financial ratios that we have chosen. These ratios are typically used in literature and, in most cases, used by, for example, The International Association of Insurance Supervisors, the international organism that analyses the insurance markets, and the OCDE.
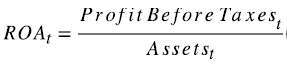
ROA: Return on assets. It is one of the most popular ratios. It represents the economic return of a firm. High values of this ratio indicate that the insurer is making its assets profitable and, consequently, well managed. It proxies the insurer’s efficiency in managing the company’s assets (2).
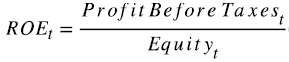
ROE: Return on equity. This ratio is typically used in financial analysis, as it shows the relation between profit and company’s capital. When a firm is performing efficiently, ROE’s high values are observed, meaning that the firm is generating more profit with less capital (3).
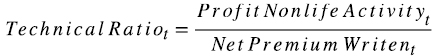
Technical Ratio. This ratio measures the insurer’s performance, considering exclusively its underwriting activity. It indicates the amount of profit in relation to premiums. High values for this ratio are related to the insurer’s good management and business efficiency (4).
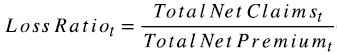
Loss Ratio. It represents the proportion of premiums used to pay for claims, so the lower, the better. A high value of this ratio means that the insurer is poorly managed and should have better control over future payments and the policy of underwriting processes (5).
Combined Ratio. The combined ratio is the sum of the loss and expenses ratios, calculated as the total underwriting expenses over the total net premium. This ratio is a proxy for the insurer’s technical profitability. The value of this ratio would be below 1 if the insurer is choosing appropriately its policyholders and doing good management of the claims. If the value of this ratio is greater than 1, expenses are greater than premiums, so the insurer’s underwriting activity generates losses, which could be compensated through financial activity. Nevertheless, in non-life insurance, financial activity is not as important as in life insurance (6).

Premium Growth Ratio. This ratio reflects the evolution of the premiums yearly. If, for a particular decision-making unit (DMU), this ratio is higher than the mean of the market, it means that the DMU is expanding its market share. This variable has been included as a dummy in the econometric analysis, Market share expansion, to control for the evolution of the market share. It is defined as 1 if the Premium Growth Ratio is higher than the mean of the market and 0 otherwise (7).

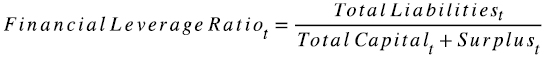
Financial Leverage Ratio. It represents the company’s ratio of liabilities compared to capital. It is related to the insurer’s financing policy (8).
Premium Retention Ratio. This is the inverse of the reinsurance ratio. It is important since high levels of reinsurance are considered a sign of inadequate risk management, which would indicate a less efficient behavior of the insurer. High values of this ratio indicate less proportion of reinsurance, so a good and efficient risk management insurer (9).
Diversified: a dummy variable for diversified insurers, defined as 1 if the firm is diversified and 0 otherwise. A firm is considered diversified when the number of business lines is higher than 4 and non-diversified when it has between 0 and 3 lines.
Mutual: a dummy variable for mutuals, defined as 1 if the firm is a mutual and 0 otherwise.
Negative GDP growth: a dummy variable to control for the years of economic crisis, defined as 1 if the Spanish GDP growth of that year is negative and 0 otherwise. This macroeconomic variable has been included to control for the potential effect of the country’s economic situation on our analysis.
Table 1 summarises the main descriptive statistics of all the variables and ratios considered in the econometric analysis.
Table 1. Descriptive statistics of the variables in the Spanish insurers’ dataset.
|
Variable |
Mean |
Std. Dev. |
Min. |
Max. |
N |
||||||
|
Panel A: Variables |
|||||||||||
|
Premium Written |
241,650.10 |
558,956.37 |
63.295 |
4,106,832.38 |
926 |
||||||
|
Insurance Expenses |
47,166.74 |
104,925.62 |
0 |
799,394.56 |
926 |
||||||
|
Operation Expenses |
7,993.46 |
16,730.59 |
5.138 |
130,082.65 |
926 |
||||||
|
Underwriting Profit |
25,152.48 |
64,665.26 |
1.256 |
593,213.18 |
926 |
||||||
|
Investment Profit |
8,252.10 |
21,346.57 |
0 |
173,606.34 |
926 |
||||||
|
Equity |
191,382.45 |
427,300.68 |
670.855 |
3,997,434.88 |
926 |
||||||
|
Total Assets |
1,322,917.46 |
3,220,941.93 |
1711.326 |
22,752,090.11 |
926 |
||||||
|
Panel B: Financial ratios |
|||||||||||
|
ROE |
0.1395 |
0.1557 |
–1.38 |
0.85 |
926 |
||||||
|
ROA |
0.0473 |
0.0515 |
–0.3 |
0.26 |
926 |
||||||
|
Technical Ratio |
0.1208 |
0.1267 |
–0.4919 |
0.7304 |
926 |
||||||
|
Loss Ratio |
0.6529 |
0.2109 |
0.02 |
1.45 |
926 |
||||||
|
Expenses Ratio |
0.2482 |
0.1489 |
0.01 |
0.98 |
926 |
||||||
|
Combined Ratio |
0.9008 |
0.1488 |
0.23 |
1.61 |
926 |
||||||
|
Premium Growth Ratio |
0.0463 |
0.2762 |
–0.79 |
3.48 |
836 |
||||||
|
Financial Leverage Ratio |
3.3492 |
4.6374 |
0.02 |
28.86 |
926 |
||||||
|
Premium Retention Ratio |
0.8906 |
0.1761 |
0.06 |
1.87 |
926 |
||||||
|
Panel C: Firm dummy variables |
|||||||||||
|
Frequency (0) |
Frequency (1) |
Min. |
Max. |
N |
|||||||
|
Diversified |
575 |
351 |
0 |
1 |
926 |
||||||
|
Mutuality |
668 |
258 |
0 |
1 |
926 |
||||||
|
Market share expansion |
545 |
291 |
0 |
1 |
836 |
||||||
|
Negative GDP growth |
451 |
475 |
0 |
1 |
926 |
||||||
Note: Panel A, variables in miles of €.
4. BACKGROUND
This section aims to give a general overview of the Spanish insurance market. Prior analysis of the insurance sector in Spain indicates that there has been a continuity in the restructuring and consolidation process of the sector that began in the 1980s. This process started with a net drop in the number of active entities and an increase in their average size, with no evidence of an intensification of competition. Additionally, studies show the generally good financial situation of Spanish insurers, with a growth path, both among mutuals and stock companies (Chopo-Murillo, 2014).
According to Swiss (2018), in 2017, the Spanish insurance market ranked 15th worldwide, with more than $70 million traded through direct premiums. The Spanish market is ahead of other European countries, such as Switzerland, Sweden, Belgium, Finland or Portugal, with one of the greatest rates of insurance market development. Moreover, Manzano (2017) affirms that the Spanish insurance sector has solidly overcome the economic crisis of recent years. According to data from the Mapfre 2018 report (Mapfre, 2018), the non-life insurance market in Spain has grown by more than 7 % from 2007-2017. As seen in Table 2, the evolution of the main financial ratios supports the robustness of this growth.
Table 2. Spanish insurer’s financial ratios between 2008 and 2017.
|
2008 |
2009 |
2010 |
2011 |
2012 |
2013 |
2014 |
2015 |
2016 |
2017 |
Mean |
|
|
ROE |
0.12 |
0.13 |
0.09 |
0.14 |
0.13 |
0.12 |
0.12 |
0.1 |
0.12 |
0.12 |
0.12 |
|
ROA |
0.04 |
0.04 |
0.04 |
0.05 |
0.05 |
0.05 |
0.04 |
0.04 |
0.04 |
0.04 |
0.04 |
|
Technical Ratio |
0.07 |
0.12 |
0.10 |
0.11 |
0.12 |
0.11 |
0.11 |
0.10 |
0.11 |
0.09 |
0.10 |
|
Loss Ratio |
0.67 |
0.67 |
0.69 |
0.66 |
0.67 |
0.66 |
0.66 |
0.66 |
0.64 |
0.65 |
0.66 |
|
Expenses Ratio |
0.25 |
0.25 |
0.24 |
0.25 |
0.25 |
0.25 |
0.25 |
0.26 |
0.26 |
0.26 |
0.25 |
|
Combined Ratio |
0.92 |
0.92 |
0.92 |
0.91 |
0.91 |
0.92 |
0.91 |
0.92 |
0.90 |
0.91 |
0.91 |
|
Premium Growth Ratio |
0.00 |
0.10 |
0.18 |
0.04 |
0.05 |
0.03 |
0.00 |
0.02 |
0.03 |
0.03 |
0.05 |
|
Financial Leverage Ratio |
3.60 |
3.46 |
3.70 |
3.62 |
3.19 |
3.09 |
2.91 |
2.90 |
2.97 |
2.89 |
3.23 |
|
Premium Retention Ratio |
0.87 |
0.87 |
0.88 |
0.89 |
0.9 |
0.92 |
0.9 |
0.89 |
0.88 |
0.88 |
0.89 |
Based on the results of these ratios for the companies analyzed, we see that the evolution of the three main profit ratios (ROE, ROA and Technical Ratio) is positive. Although there was a decrease in 2010 and 2015, during the periods of the economic crisis, insurers maintained high levels of profitability through all years, ending the period with higher values than those obtained at the beginning. The evolution of Expenses, Loss, and Combined Ratios is much more stable. This indicates that, despite the increase in premiums, this increase has not translated into higher expenses in managing premiums and claims. This points to a good management of Spanish insurance companies.
The evolution of the Premium Retention Ratio, the inverse of the Reinsurance Ratio, indicates that, until 2011, insurance companies increased the level of risk assumed, although, onwards, they decided to rely on reinsurance to maintain their risk levels. Finally, the Leverage Ratio has decreased throughout the period, undoubtedly improving the sector’s solvency.
5. RESULTS
In this paper, we first calculate the efficiency scores of the non-life Spanish insurance firms through a two-stage DEA model to study the relationship between efficiency and profitability. Table 3 shows a summary of the results obtained. The efficiency levels remain constant all over the period, and high levels of dispersion across the different insurers are not observed. Additionally, the analysis of the efficiency of the Spanish insurance market has also been conducted using SFA techniques to check the robustness of the scores obtained through two-stage DEA. Afterwards, correlations between DEA and SFA scores have been computed, showing that both procedures provide similar, significant, and positively correlated results. Results are disposable upon request.
Table 3. Efficiency level of the non-life Spanish insurers: Two-stage DEA results by year.
|
Variable |
Mean |
Std. Dev. |
Min. |
Max. |
N |
|
Average efficiency |
0.0637 |
0.0946 |
0.0002 |
0.9362 |
926 |
|
Efficiency 2008 |
0.0839 |
0.1037 |
0.0026 |
0.6385 |
90 |
|
Efficiency 2009 |
0.0588 |
0.0824 |
0.0008 |
0.4521 |
95 |
|
Efficiency 2010 |
0.068 |
0.0922 |
0.0002 |
0.5878 |
90 |
|
Efficiency 2011 |
0.0615 |
0.1212 |
0.0004 |
0.9362 |
95 |
|
Efficiency 2012 |
0.0501 |
0.0832 |
0.0011 |
0.4691 |
98 |
|
Efficiency 2013 |
0.0678 |
0.1062 |
0.0006 |
0.6169 |
97 |
|
Efficiency 2014 |
0.0591 |
0.0784 |
0.0016 |
0.3561 |
94 |
|
Efficiency 2015 |
0.0567 |
0.0818 |
0.001 |
0.3931 |
92 |
|
Efficiency 2016 |
0.0711 |
0.1013 |
0.0009 |
0.4834 |
89 |
|
Efficiency 2017 |
0.0617 |
0.0858 |
0.0012 |
0.5215 |
86 |
Once each insurer’s efficiency and financial ratios have been calculated, we proceed to comment on the research questions proposed in the introduction using the results of the econometric analysis presented in Tables 4-6. Results are consistent between all the estimation models proposed and allow us to give a robust answer to our research questions
Table 4. Efficiency-profitability relation: Random effects estimation results.
|
(1) |
(2) |
(3) |
(4) |
(5) |
|
|
ROE |
ROA |
Technical Ratio |
Combined Ratio |
Loss Ratio |
|
|
DEA2E technical eff. |
0.708∗∗∗ |
0.349∗∗∗ |
1.073∗∗∗ |
–1.283∗∗∗ |
–0.957∗∗∗ |
|
–5.63 |
–10.48 |
–10.33 |
(-13.20) |
(-9.42) |
|
|
DEA2E technical eff. sq. |
–0.737∗∗∗ |
–0.337∗∗∗ |
–1.060∗∗∗ |
1.201∗∗∗ |
0.878∗∗∗ |
|
(-4.02) |
(-7.39) |
(-7.39) |
–9.18 |
–6.55 |
|
|
Total Assets |
0.00325 |
–0.00472∗∗ |
0.0062 |
0.00475 |
0.0135 |
|
–0.65 |
(-2.82) |
–1.24 |
–0.87 |
–1.88 |
|
|
Financial Leverage Ratio |
0.00277 |
–0.00112 |
–0.000777 |
–0.00261 |
0.00351 |
|
–1.38 |
(-1.95) |
(-0.44) |
(-1.52) |
–1.9 |
|
|
Premium Retention Ratio |
0.125∗∗∗ |
0.0440∗∗∗ |
0.0995∗∗ |
–0.106∗∗∗ |
–0.138∗∗∗ |
|
–3.32 |
–4.26 |
–3.1 |
(-3.47) |
(-4.29) |
|
|
Premium Growth Ratio |
–0.00916 |
–0.00493 |
–0.0231∗ |
0.0230∗ |
0.0194∗ |
|
(-0.68) |
(-1.53) |
(-2.27) |
–2.5 |
–2.09 |
|
|
Market share expansion |
0.0144 |
0.0023 |
0.00231 |
–0.0104 |
–0.0141∗ |
|
–1.67 |
–1.1 |
–0.35 |
(-1.74) |
(-2.32) |
|
|
Diversified |
0.0686∗∗∗ |
0.0143∗ |
0.00438 |
–0.0450∗∗ |
–0.0109 |
|
–3.7 |
–2.55 |
–0.26 |
(-2.63) |
(-0.57) |
|
|
Mutuality |
–0.135∗∗∗ |
–0.0529∗∗∗ |
–0.0426 |
0.105∗∗∗ |
0.0949∗ |
|
(-6.24) |
(-6.53) |
(-1.79) |
–3.72 |
–2.21 |
|
|
Negative GDP growth |
0.0200∗∗ |
0.00485∗∗ |
0.00635 |
0.00436 |
0.00712 |
|
–2.98 |
–3 |
–1.25 |
–0.95 |
–1.52 |
|
|
Constant |
–0.0955 |
0.0864∗∗ |
–0.127 |
0.980∗∗∗ |
0.543∗∗∗ |
|
(-1.01) |
–2.7 |
(-1.33) |
–9.31 |
–3.9 |
|
|
Observations |
836 |
836 |
836 |
836 |
836 |
t Student statistics in parentheses
∗ p < 0.05, ∗∗ p < 0.01, ∗∗∗ p < 0.001
Table 5. Efficiency-profitability relation: PCSE estimation results.
|
(1) |
(2) |
(3) |
(4) |
(5) |
|
|
ROE |
ROA |
Technical Ratio |
Combined Ratio |
Loss Ratio |
|
|
DEA2E technical eff. |
0.603*** |
0.294*** |
0.956*** |
–0.959*** |
–0.790*** |
|
–5.45 |
–6.82 |
–8.14 |
(-7.67) |
(-5.13) |
|
|
DEA2E technical eff. sq. |
–0.575*** |
–0.265*** |
–0.929*** |
0.902*** |
0.650*** |
|
(-4.49) |
(-4.95) |
(-6.79) |
–6.41 |
–4.29 |
|
|
Total Assets |
0.0129** |
–0.00188* |
0.00481 |
0.00787* |
0.0185*** |
|
–3.06 |
(-2.25) |
–1.25 |
–2.13 |
–4.67 |
|
|
Financial Leverage Ratio |
–0.00197 |
–0.00286*** |
0.000605 |
–0.00275 |
–0.00234 |
|
(-0.89) |
(-7.69) |
–0.39 |
(-1.52) |
(-1.12) |
|
|
Premium Retention Ratio |
0.0742* |
0.0335*** |
0.0175 |
–0.0381 |
0.0201 |
|
–2.51 |
–3.41 |
–0.37 |
(-1.14) |
–0.44 |
|
|
Premium Growth Ratio |
–0.0210* |
–0.00513 |
–0.0262** |
0.0214* |
0.024 |
|
(-2.17) |
(-1.65) |
(-3.21) |
–2.01 |
–1.7 |
|
|
Market share expansion |
0.0243** |
0.00470* |
0.00844 |
–0.0146* |
–0.0174** |
|
–2.63 |
–2.45 |
–1.53 |
(-2.47) |
(-3.19) |
|
|
Diversified |
0.0520*** |
0.0124** |
–0.00431 |
–0.0205 |
–0.0277 |
|
–3.91 |
–3.11 |
(-0.38) |
(-1.74) |
(-1.54) |
|
|
Mutual |
–0.123*** |
–0.0470*** |
–0.0309 |
0.0890*** |
0.0779*** |
|
(-9.59) |
(-14.00) |
(-1.68) |
–4.78 |
–3.94 |
|
|
Negative GDP growth |
0.00904 |
0.0022 |
0.00504* |
0.000533 |
–0.00277 |
|
–1.18 |
–1.37 |
–1.97 |
–0.17 |
(-0.49) |
|
|
Constant |
–0.202** |
0.0498** |
–0.0263 |
0.839*** |
0.339*** |
|
(-2.66) |
–3.08 |
(-0.30) |
–11.64 |
–4.94 |
|
|
Observations |
836 |
836 |
836 |
836 |
836 |
t Student statistics in parentheses
∗ p < 0.05, ∗∗ p < 0.01, ∗∗∗ p < 0.001
Table 6: Efficiency-profitability relation: FGLS estimation results.
|
(1) |
(2) |
(3) |
(4) |
(5) |
|
|
ROE |
ROA |
Technical Ratio |
Combined Ratio |
Loss Ratio |
|
|
DEA2E technical eff. |
0.629*** |
0.304*** |
1.002*** |
–0.988*** |
–0.817*** |
|
–5.42 |
–9.94 |
–10.68 |
(-10.18) |
(-7.14) |
|
|
DEA2E technical eff. sq. |
–0.592*** |
–0.271*** |
–0.961*** |
0.923*** |
0.680*** |
|
(-3.51) |
(-6.30) |
(-7.69) |
–7.11 |
–4.68 |
|
|
Total Assets |
0.0129** |
–0.00242* |
0.00489 |
0.00994* |
0.0204*** |
|
–2.94 |
(-1.99) |
–1.2 |
–2.38 |
–3.72 |
|
|
Financial Leverage Ratio |
–0.00168 |
–0.00265*** |
0.00032 |
–0.00319 |
–0.0029 |
|
(-0.87) |
(-5.02) |
–0.19 |
(-1.80) |
(-1.30) |
|
|
Premium Retention Ratio |
0.0655 |
0.0283** |
0.00889 |
–0.0754* |
–0.0275 |
|
–1.84 |
–2.99 |
–0.3 |
(-2.47) |
(-0.75) |
|
|
Premium Growth Ratio |
–0.021 |
–0.00508 |
–0.0280** |
0.0200* |
0.0221* |
|
(-1.62) |
(-1.56) |
(-3.01) |
–2.07 |
–2.07 |
|
|
Market share expansion |
0.0238** |
0.00433 |
0.00917 |
–0.0155* |
–0.0204** |
|
–2.73 |
–1.95 |
–1.43 |
(-2.33) |
(-2.75) |
|
|
Diversified |
0.0518** |
0.0121** |
0.0016 |
–0.0370* |
–0.0368 |
|
–3.12 |
–2.65 |
–0.11 |
(-2.41) |
(-1.89) |
|
|
Mutual |
–0.129*** |
–0.0501*** |
–0.0514** |
0.111*** |
0.109*** |
|
(-7.39) |
(-10.28) |
(-3.10) |
–6.5 |
–4.72 |
|
|
Negative GDP growth |
0.00936 |
0.00232 |
0.00332 |
–0.0000388 |
–0.00293 |
|
–1.33 |
–1.3 |
–0.65 |
(-0.01) |
(-0.50) |
|
|
Constant |
–0.196* |
0.0634** |
–0.0219 |
0.843*** |
0.349*** |
|
(-2.37) |
–2.77 |
(-0.29) |
–10.73 |
–3.39 |
|
|
Observations |
834 |
834 |
834 |
834 |
834 |
t Student statistics in parentheses
∗ p < 0.05, ∗∗ p < 0.01, ∗∗∗ p < 0.001
The first research question (RQ1) aims to study whether there is a positive E-P relationship in the non-life insurance companies in the Spanish market. We conduct a random effects regression model explaining the profitability ratios presented in Section 3 using the insurer’s efficiency levels obtained from the two-stage DEA (Table 3). Results from this estimation, which we display in Tables 4-6, align with our prior hypotheses. According to the sign of the coefficient of the efficiency variable, there is a positive relation between efficiency scores and profitability ratios ROE, ROA and the Technical Ratio, and a negative relation for ratios based on expenses, namely, Combined Ratio and Loss Ratio. As an additional analysis, we conducted Pearson, Spearman and Kendall’s correlation tests between efficiency levels and the different profitability ratios, finding a positive correlation, thus corroborating our prior findings. Results are available upon request.
The second research question (RQ2) examines the existence of decreasing returns in the E-P relation. Our results show the existence of such decreasing returns in the case of profits’ ratios (Columns 1, 2 and 3) since the sign of the coefficients of the variable efficiency (β1) and efficiency squared (β2) are positive and negative, respectively. This indicates that the positive effect of efficiency on profit ratios is smaller for the most efficient non-life insurers than for the inefficient ones. In addition, the signs of the coefficients point to a relationship corresponding to an increasing and concave functional form, which is the typical representation of diminishing returns. The theoretical maximum profit ratio of the curve will only be reached beyond the efficiency score of 1, which is not possible since efficiency ratios only take values between 0 and 1. Consequently, this functional form confirms that efficiency and profitability are positively related, as well as the existence of diminishing marginal returns, results that are also consistent with previous findings (Leverty and Grace, 2010; Eling and Jia, 2019). The estimation using Combined Ratio and Loss Ratio, which are ratios aimed at measuring losses, provide outcomes confirming the E-P relation (see coefficients in Columns 4 and 5).
Another target of this paper, according to the third research question (RQ3), is to analyze the influence of diversification on the efficiency and profitability of non-life Spanish insurers. First, we study whether diversification affects efficiency by conducting a two-sample t-test for the difference of means on the efficiency level of each type of company. As seen in Table 7, t(924) = 3.65 and p = 0.001, we find that average efficiency is statistically different between diversified and non-diversified firms, being diversified firms, on average, less efficient. Therefore, in the case of non-life Spanish insurers, serving a greater number of branches might imply worse administrative business management. Second, to study the effect of diversification on profitability, we also include this variable in ratios’ regressions, finding this variable statistically significant for two profitability ratios. It has a positive and significant effect on ROE and ROA and a negative and significant effect on the Combined Ratio, indicating that the number of business lines positively affects profitability. In other words, although non-diversified companies are, on average, more efficient than diversified ones, having more branches seems to translate into better profitability ratios.
Table 7. Two-sample t-test for the difference in efficiency means between diversified and non-diversified firms.
|
N |
Mean |
|
|
Diversified |
575 |
0.055 |
|
Non-diversified |
351 |
0.078 |
|
Diff. |
0.024 |
|
|
Std. Err. |
0.007 |
|
|
t value |
3.65 |
|
|
p-value |
0.001 |
Finally, to answer the last research question (RQ4) posed, which examines the influence of the type of ownership on efficiency and profitability, another two-sample t-test for the difference of means between the efficiency obtained by mutuals and non-mutuals was computed. According to our results in Table 8, t(924) = −4.90 and p = 0.000, we conclude that there is a significant difference between mutuals and non-mutuals efficiency, being mutuals on average more efficient. Remarkably, this result is similar to that of Cummins et al. (2004) also for the Spanish market. Additionally, to test the importance of a company’s organizational structure on profitability, this dummy has also been considered in the different ratios’ regressions. Results indicate that this variable is significant and negative for ROE and ROA ratios and significant and positive for Combined Ratio and Loss Ratio regressions. This points out that mutual insurers are less profitable than stock companies. Similar behavior is found by Cummins and Nini (2002) or Gaganis et al. (2015).
Table 8. Two-sample t-test for the difference of efficiency means between mutuals and non-mutuals.
|
N |
Mean |
|
|
Mutual |
258 |
0.088 |
|
Non-mutual |
668 |
0.054 |
|
Diff. |
–0.034 |
|
|
Std. Err. |
0.007 |
|
|
t value |
–4.90 |
|
|
p-value |
0.000 |
6. CONCLUSIONS AND DISCUSSION
The main objective of this research is to study the E-P relationship. A deeper understanding of the E-P relation would help executives and managers make better informed decisions to improve both efficiency in resources management and performance. Lots of papers have analyzed the efficiency of insurance markets through different approaches (see Eling and Luhnen (2010 a, b) or Kaffash et al. (2020) for a review). Also, a large number of researchers have studied insurers’ profitability (see Pjanic et al. (2018) for a review). However, so far, literature focused on the E-P relationship is scarce, highlighting the works of Greene and Segal (2004), Leverty and Grace (2010), and Eling and Jia (2019). This paper contributes to prior literature by examining the E-P relationship in the Spanish non-life insurance market. As far as these authors know, this is the first paper that jointly analyzes E-P for the Spanish case.
We use information from 111 non-life insurers in Spain from 2008-2017 to study the E-P relationship. Firstly, we measure the efficiency level of each firm using the two-stage DEA methodology. Secondly, we calculate the most important financial ratios to evaluate Spanish insurers’ profitability and financial performance. We conclude that the Spanish non-life insurance market has good financial health. Thirdly, to focus on the E-P relationship, we conduct an econometric analysis to regress the financial ratios to the efficiency scores obtained with the two-stage DEA procedure and other important control variables, such as companies’ organizational structure or the insurer’s diversification. This allows us to answer our four research questions, whose results are summarized in the following paragraphs.
RQ1. Are the efficiency and profitability of non-life insurance companies in the Spanish market positively related?
Our results, as expected, point to a positive relation between efficiency scores and profitability ratios in the non-life Spanish insurance market, in line with the findings of Greene and Segal (2004); Leverty and Grace (2010), and Eling and Jia (2019). This confirms our prior hypothesis of a positive E-P relation.
RQ2. Is the relation between efficiency and profitability in the Spanish non-life insurance market constant, or does it follow the law of diminishing marginal returns?
Although positive, the relation E-P shows decreasing returns, with the positive effect of efficiency on profit ratios smaller for the most efficient non-life insurers than the inefficient ones. So, as in Eling and Jia (2019), we can affirm that the E-P relationship in the Spanish non-life insurance market follows the law of diminishing marginal returns.
RQ3. Does diversification contribute to more efficient and profitable insurers in the Spanish non-life insurance sector?
To better understand the E-P relationship, we study the influence of diversification. We find a significant difference between diversified and non-diversified companies’ efficiency levels, with non-diversified ones more efficient than diversified insurers. Despite this, according to our findings, diversification has a positive effect on profitability. This result aligns with Cummins et al. (2010), who found diversified firms less efficient, and Bikker and Gorter (2011), who found them more profitable.
RQ4. Does the type of firm ownership affect efficiency and profitability of insurers in the Spanish Non-Life sector?
Regarding the type of ownership, our results suggest that mutual insurers are more efficient but less profitable than stock insurers for the Spanish non-life sector. Being a mutual has a negative and significant impact on profit ratios such as ROE or ROA. Previous studies obtained similar results for mutuals. Cummins et al. (2004) also conclude that this type of company is more efficient, and Cummins and Nini (2002) confirm that they are less profitable than stock insurers.
Our study aims to get a more comprehensive knowledge of the E-P relationship for the Spanish nonlife insurance market, contributing to the previous literature on this topic. The results obtained in this paper are helpful for directives and decision makers in the insurance markets since managers are always seeking to improve their business performance, efficiency, and profitability.
REFERENCES
& (2016). Competition and efficiency in the non-life insurance market in South Africa, Journal of Economic Studies 43(6), 882–909.
(2001). La medición de la eficiencia y la productividad, ISBN: 84-368-1586-6, Pirámide.
, & (2020). Determinants of profitability of general insurance companies in Indonesia, Jurnal Ilmiah Manajemen Fakultas Ekonomi 6(2), 135–144.
, , & (2000). Conglomeration versus strategic focus: Evidence from the insurance industry, Journal of Financial Intermediation 9(4), 323–362.
& (2012). Organization and efficiency in the international insurance industry: A cross-frontier analysis, European Journal of Operational Research 221, 454–468.
& (2011). Performance of the Dutch non-life insurance industry: Competition, efficiency and focus, Journal of Risk and Insurance 78(1), 163–194.
& (2019). Determinants of profitability of life and non-life insurance companies: evidence from Ecuador, International Journal of Emerging Markets, 14(5), 831–872.
, & (2019). Competition in the insurance industry in Ecuador: An econometric analysis in life and non-life markets, The Quarterly Review of Economics and Finance, 71, 291–302.
(2012). On the determinants of profitability of Indian life insurers, an empirical study, Proceedings of the World Congress on Engineering 1(WCE 2012, London, U.K).
, , & (2009). Additive efficiency decomposition in two-stage DEA, European Journal of Operational Research 196(3). 1170-1176.
(2014). El sector asegurador en España: Diversificación y resultados, PhD thesis, Universidad de Zaragoza.
& (2014). Systemic risk and the US insurance sector, Journal of Risk and Insurance 81(3), 489–528. https://onlinelibrary.wiley.com/doi/abs/10.1111/jori.12039
& (2002). Optimal capital utilization by financial firms: Evidence from the property-liability insurance industry, Journal of Financial Services Research 21(1-2), 15–53.
, & (2004). The effect of organizational structure on efficiency: Evidence from the Spanish insurance industry, Journal of Banking and Finance 28(12), 3113– 3150.
, , & (2010). Economies of scope in financial services: A DEA efficiency analysis of the US insurance industry, Journal of Banking and Finance 34(7), 1525– 1539.
& (1998). Comparison of frontier efficiency methods: An application to the US life insurance industry, Journal of Productivity Analysis 10(2), 131–152.
& (2011). Is efficiency an important determinant of A.M. best property- liability insurer financial strength ratings? Journal of Insurance Issues 34(1), 18–33.
& (2019). Efficiency and profitability in the global insurance industry, Pacific- Basin Finance Journal 57, 101190.
& (2010a). Frontier efficiency methodologies to measure performance in the insurance industry: Overview, systematization and recent developments, Geneva Papers on Risk and Insurance 35(2), 217–1265.
& (2010b). Efficiency in the international insurance industry: A cross- country comparison, Journal of Banking and Finance 34(7), 1497–1509.
, , & (1993). Productive performance in the French insurance industry, Journal of Productivity Analysis 4(1-2), 77–93.
& (2017). A stochastic frontier analysis of efficiency in Argentina’s non-life insurance market, The Geneva Papers on Risk and Insurance 43(1), 158–174.
, & (2013). Efficiency and stocks return. Evidence from the insurance industry, Journal of Productivity Analysis 40, 429–442.
, & (2015). Regulations, profitability, and risk-adjusted re- turns of European insurers: An empirical investigation, Journal of Financial Stability 18(C), 55– 77.
, & (2023). Multi-objective reference point techniques to optimize profitability, growth, and risk in the non-life insurance industry: international analysis, International Transactions in Operational Research, 30: 2546-2570.https://doi.org/10.1111/itor.13155
& (2004). Profitability and efficiency in the US life insurance industry, Journal of Productivity Analysis 21(3), 229–247. https://doi.org/10.1023/B:PROD.0000022092.70204.fa
, & (2023). Analyzing the profitability and efficiency in European Non-Life insurance industry, Methodology and Computing in Applied Probability 25(2). 1-25. https://doi.org/10.1007/s11009-023-10043-0
, , & (2020). A survey of data envelopment analysis applications in the insurance industry 1993-2018, European Journal of Operational Research 284(3), 801–813.
& (2008). Efficiency decomposition in two-stage data envelopment analysis. an application to non-life insurance companies in Taiwan, European Journal of Operational Research 185, 418–429.
, & (2017). Profitability determinants of insurance markets in selected Central and Eastern European countries, International Journal of Economic Sciences 6(2), 100–123.
& (2010). The robustness of output measures in property/liability insurance efficiency studies, Journal of Banking and Finance 34(7), 1510–1524.
& (2008). Effects of corporate diversification: Evidence from the property–liability insurance industry, Journal of Risk and Insurance 75(4), 893–919. https://onlinelibrary.wiley.com/doi/abs/10.1111/j.1539-6975.2008.00290.x
(2017). Spain’s insurance sector: Profitability, solvency and concentration, Funcas SEFO 7(1), 1–8.
Mapfre (2018). The Spanish insurance market in 2017, MAPFRE Economic Research, Fundacion Mapfre.
& (2014). Non-life insurance economic performances - an empirical investigation, Journal of Economics Management 18, 159–177.
(2013). Efficiency of non-life insurance business in Kenya: Stochastic frontier approach, Available at SSRN: https://ssrn.com/abstract=2262754 http://dx.doi.org/10.2139/ssrn.2262754.
, , & (2018). Profitability determinants of non-life insurance companies in Serbia, Ekonomika preduzeca 66, 333–345.
(2020). Ownership structure and financial stability: Evidence from Takaful and conventional insurance firms, Pacific-Basin Finance Journal 62, 101355. https://www.sciencedirect.com/science/article/pii/S0927538X20300433
, & (2012). Application of two-stage DEA technique for efficiencies measuring of private insurance companies in Iran, International Journal of Applied Operational Research 1(3), 91–104.
, & (2021). A comparison of DEA and SFA approaches: Application to the US non-life insurance market, Applied Economics Journal 28(2), 107–127.
(2018). Profitability in non-life insurance: Mind the gap, Sigma 4.
& (2016). Profitability evaluation and ranking of Indian non- life insurance firms using GRA and TOPSIS, European Journal of Business and Management 8(22). 153-170.
, , & (2021). Revisiting market power and efficiency: the non-linearities over profitability, Applied Economics Letters, 28(21), 1860-1864.